. 2011 Feb;105(2):896-909.
doi: 10.1152/jn.00313.2010. Epub 2010 Dec 15.

Encoding of eye position in the goldfish horizontal oculomotor neural integrator

Affiliations

Encoding of eye position in the goldfish horizontal oculomotor neural integrator

Owen Debowy et al. J Neurophysiol. 2011 Feb.

Abstract

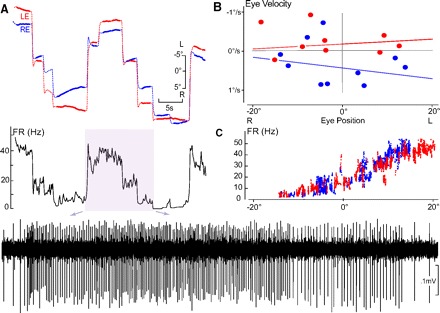
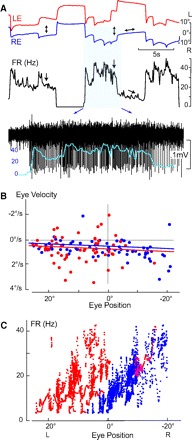
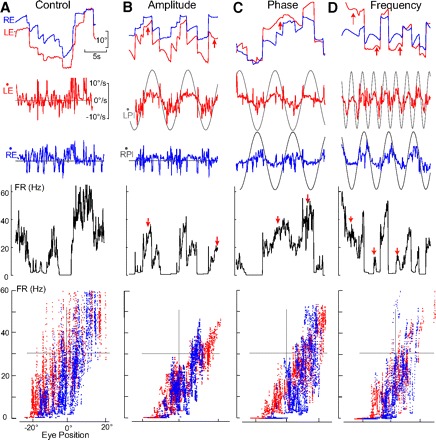
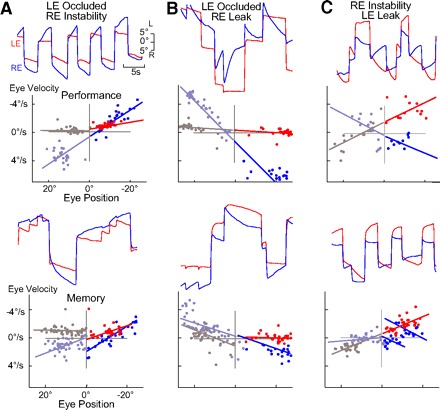
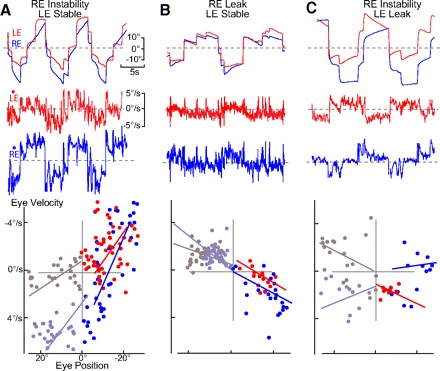
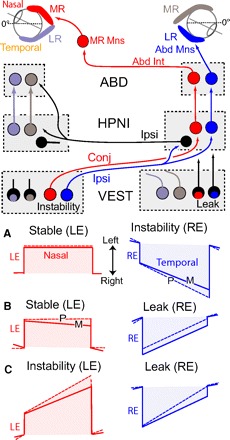
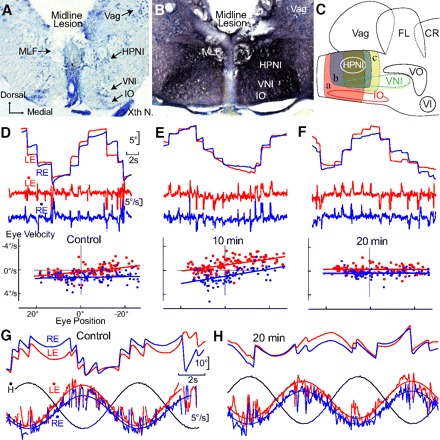
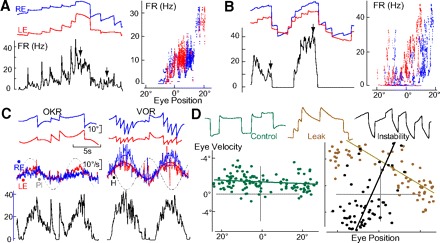
Monocular organization of the goldfish horizontal neural integrator was studied during spontaneous scanning saccadic and fixation behaviors. Analysis of neuronal firing rates revealed a population of ipsilateral (37%), conjugate (59%), and contralateral (4%) eye position neurons. When monocular optokinetic stimuli were employed to maximize disjunctive horizontal eye movements, the sampled population changed to 57, 39, and 4%. Monocular eye tracking could be elicited at different gain and phase with the integrator time constant independently modified for each eye by either centripetal (leak) or centrifugal (instability) drifting visual stimuli. Acute midline separation between the hindbrain oculomotor integrators did not affect either monocularity or time constant tuning, corroborating that left and right eye positions are independently encoded within each integrator. Together these findings suggest that the "ipsilateral" and "conjugate/contralateral" integrator neurons primarily target abducens motoneurons and internuclear neurons, respectively. The commissural pathway is proposed to select the conjugate/contralateral eye position neurons and act as a feedforward inhibition affecting null eye position, oculomotor range, and saccade pattern.


Figures

Fig. 1.
Fig. 1.
Conjugate left side horizontal eye position neural integrator (HPNI) neuron during spontaneous fixation behavior in darkness. A: FR (firing rate) in Hz correlated with left (LE, red) and right (RE, right) eye position following saccades of different amplitude. Inset: activity is expanded below as indicated by the arrows. B: P-V (eye position-velocity) plot constructed from only the fixations shown in A. Eye velocity (ordinate) was calculated from least squares regression of the eye position (filled part for each fixation). The time constant (τ) for LE was 159.7 s and RE 72.9 s. C: FR vs. eye position plot showing a correlation with both left and right eye position. Averaged LE and RE position and velocity coefficients were 1.59 (spike/s)/° and −0.29 (spike/s) per °/s, (r = 0.96) with + values leftward and – rightward.
Fig. 2.
Fig. 2.
Ipsilateral right side HPNI neuron during spontaneous fixation behavior. A: LE and RE positions, FR (Hz) and neuronal activity of a right-side (ipsilateral) HPNI neuron with monocular eye positions indicated arrows. Neuronal activity is overlain by the expanded FR curve. B: P-V plot showing a τ for LE of 111.5 s and RE 124.5 s. C: plot of FR vs. eye position in which the coefficients for the LE were −0.52 (spike/s)/° and −0.41 (spike/s) per °/s, (r = 0.48) and the RE −1.59 (spike/s)/° and −0.30 (spike/s) per °/s, (r = 0.83).
Fig. 3.
Fig. 3.
HPNI activity during monocular optokinetic reflex OKR behaviors. A–D: FR of an ipsilateral (left-side) neuron during spontaneous scanning (A) and differences in LE/RE OKR amplitude (B), phase (C), and frequency (D). Red arrows show regions of monocularity. A: FR sensitivity was found to be conjugate for the LE 1.06 (spike/s)/° and 0.21 (spike/s) per °/s, (r = 0.77) and RE 1.33 (spike/s)/° and −0.31 (spike/s) per °/s, (r = 0.74). B: PL (monocular planetarium) amplitude differences (LPl, 15.7°/s and RPl, 0°/s) produced monocular LE and RE velocity gains of 0.31 and 0.05 with similar phase leads of 7° and 14°. FR sensitivity was LE 1.13 (spike/s)/° and 1.02 (spike/s) per °/s, (r = 0.92) and for the RE 1.57 (spike/s)/° and 1.40 (spike/s) per °/s, (r = 0.72). C: LPl and RPl were of similar amplitude (15.7°/s) but 180° out-of-phase. Gains were similar (0.16) but with a phase lag of 166.2° resulting in oppositely directed velocity sensitivity. LE sensitivity was 1.28 (spike/s)/° and 0.40 (spike/s) per °/s, (r = 0.92) and RE 1.47 (spike/s)/° and −2.18 (spike/s) per °/s, (r = 0.75). D: LPl and RPl were of similar amplitude (15.7°/s), but at different frequency (0.4 and 0.18 Hz). LE and RE gains were similar (0.20 and 0.23) with a FR correlations of LE 1.32 (spike/s)/° and 1.42 (spike/s) per °/s, (r = 0.88) and RE 1.46 spike/s/° and 0.66 (spike/s) per °/s, (r = 0.66).
Fig. 4.
Fig. 4.
Monocular modification of integrator time constants. A–C: P-V plots and eye position records after training during performance (top) and memory (bottom) of monocular changes in the integrator time constant with + and − values indicating leak and instability, respectively. A: 6 h after the τ for RE (blue) instability performance was −5.2 s and for the occluded LE (red) −127.0 s. RE instability memory was −14.5 s and LE occlusion −194.4 s. B: τ for RE leak performance after 4 h was 3.5 s and LE stability 57.8 s. RE leak memory was 10.9 s and LE stability 107.2 s. C: τ for RE leak performance at 3 h was 7.3 s with LE instability at 8.1 s. RE memory leak was 43.2 s and LE instability −8.4 s.
Fig. 5.
Fig. 5.
Monocular visual training changes in integrator time constants. A–C: P-V plots and behavioral records in darkness (memory) after 4–6 h of monocular training to instability (A), leak (B), and leak-instability (C). A: RE was trained toward instability and the LE to stable fixation. Based on largely nasal oculomotor ranges for LE and bidirectional for RE, τ was −15.3 and −4.4 s, respectively. B: RE was trained toward leak and the LE to stable fixation. Based on oculomotor ranges largely bidirectional for RE and temporal for LE (nasal drift), τ was 7.0 and 15.4 s, respectively. C: RE instability and LE leak nasal/temporal training significantly changed τ in RE to −26.7 s and LE 11.2.
Fig. 6.
Fig. 6.
Schematic showing monocular fixation plasticity results and hypothesized neuronal connections. A–C: P (performance, dashed lines) and m (memory, solid lines) vignettes of monocular changes in time constant after 4 h visual training. Color-coding associates fixations in the LE and RE with the medial and lateral rectus eye muscles that can then be correlated with eye specific neurons in the vestibular nucleus (VEST), Area I (HPNI), and abducens (ABD) nuclei. A: RE instability and LE stability. B: RE leak and LE stability. C: RE leak and LE instability. In the diagram, monocular signaling is suggested for ipsilateral and conjugate eye movements with excitation (instability) originating from the left vestibular nucleus and inhibition (leak) from the right vestibular nucleus. Right inhibitory HPNI neurons (black) are shown to coordinate the proposed nasal and temporal eye position integrators. For simplification, connections are only shown to and from the right HPNI with direct vestibuloocular pathways to MR and Abd Mns omitted (see Supplemental Fig. S1A).
Fig. 7.
Fig. 7.
Integrator stability and time constant plasticity after acute midline lesion. A–C: anatomy of midline lesions between the bilateral HPNI nuclei. A: coronal photomicrograph showing an acute midline lesion encompassing ∼75% of the dorsal-ventral depth for behavior with P-V plots shown in D–H. B: 15 days post midline lesion photomicrograph showing extensive biocytin labeled axons in the medial longitudinal fasiculus (MLF) and reticular formation after spinal cord label. C: schematic illustrating 3 groups (a–c) of midline lesions (8 cases). D–F: P-V plots of eye position holding before (A) and 10 (B) and 30 min (C) after the midline lesion illustrated in A. Control LE τ was −127.8 s and RE −170.3 s in (A), −19.8 s and −16.6s in B, and 1,428.5 s and −384.3 s in C, respectively. G and H: vestibuloocular reflex (VOR) at 0.125 Hz and 15.7°/s before and 20 min after the lesion with least square regression fits of eye velocity. Head velocity shown in black. Gains changed minimally from (LE) 0.90 to 0.80 and (RE) 0.73 to 0.71 with negligible shifts in phase (LE) 3.2° to 2.3° and (RE) 0.2° to 3.0°. VNI, velocity neural integrator; FL, facial lobe; Vag, vagal lobe; VO, descending octaval nucleus; Xth N, vagus nerve; IO, inferior olive.
Fig. 8.
Fig. 8.
HPNI persistence and plasticity without commissure. A and B: FR (Hz) eye position records, and FR versus eye position plots during spontaneous fixation in darkness for 2 ipsilateral-eye related HPNI neurons. A: LE FR coefficients were 0.84 (spike/s)/° and 0.23 (spike/s) per °/s, (r = 0.81). RE FR constants were 0.72 (spike/s)/° and 0.33 spike/s [per] °/s, (r = 0.58). B: LE FR 1.45 (spike/s)/° and 0.63 (spike/s) per °/s, (r = 0.76) with RE FR 1.18 (spike/s)/° and 0.17 (spike/s) per °/s, (r = 0.49). C: HPNI modulation in A by head and eye velocity at 0.125 Hz during OKR and VOR. D: P-V plots and behavior 5 days after a midline lesion (c in Fig. 7C) of RE in darkness (control: 79.4 s), 2 h after leak training (5.3 s), and 4 h after instability training (−1.5 s).

Similar articles

Cited by

References

    1. Aksay E, Baker R, Seung HS, Tank DW. Anatomy and discharge properties of pre-motor neurons in the goldfish medulla that have eye-position signals during fixations. J Neurophysiol 84: 1035–1049, 2000. - PubMed
    1. Aksay E, Gamkrelidze G, Seung HS, Baker R, Tank DW. In vivo intracellular recording and perturbation of persistent activity in a neural integrator. Nat Neurosci 4: 184–193, 2001. - PubMed
    1. Aksay E, Major G, Goldman MS, Baker R, Seung HS, Tank DW. History dependence of rate covariation between neurons during persistent activity in an oculomotor integrator. Cereb Cortex 13: 1173–1184, 2003. - PubMed
    1. Aksay E, Olasagasti I, Mensh BD, Baker R, Goldman MS, Tank DW. Functional dissection of circuitry in a neural integrator. Nat Neurosci 10: 494–504, 2007. - PMC - PubMed
    1. Allum JH, Graf W, Dichgans J, Schmidt CL. Visual-vestibular interactions in the vestibular nuclei of the goldfish. Exp Brain Res 26: 463–485, 1976. - PubMed

LinkOut - more resources