. 2011 May;18(5):479-87.
doi: 10.1038/gt.2010.163. Epub 2010 Dec 16.

Quantification of lentiviral vector copy numbers in individual hematopoietic colony-forming cells shows vector dose-dependent effects on the frequency and level of transduction

Affiliations

Quantification of lentiviral vector copy numbers in individual hematopoietic colony-forming cells shows vector dose-dependent effects on the frequency and level of transduction

S Charrier et al. Gene Ther. 2011 May.

Abstract

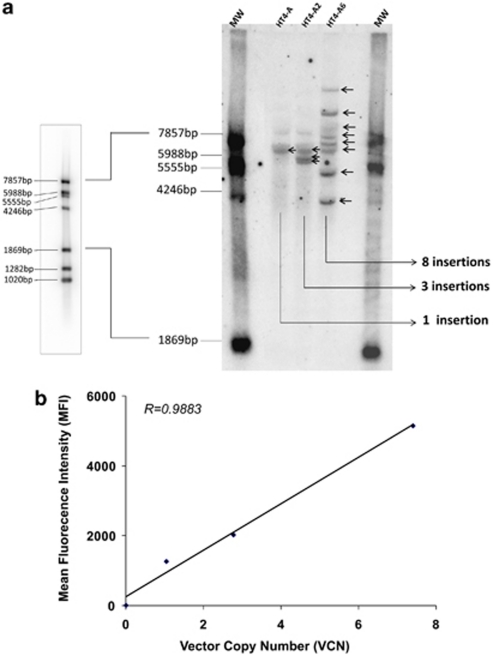
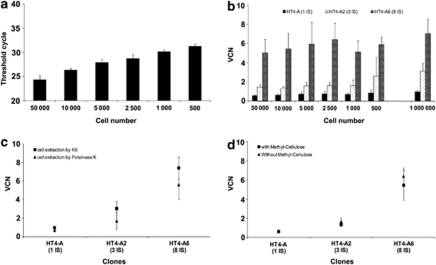
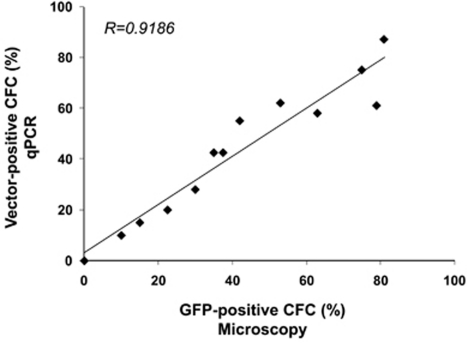
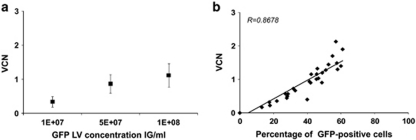
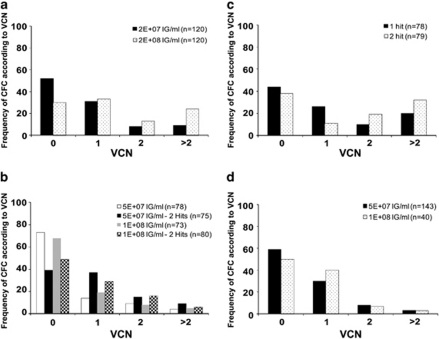
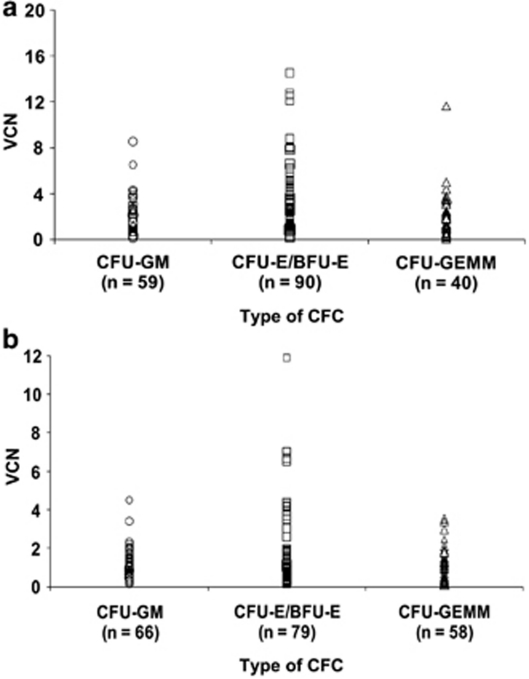
Lentiviral vectors are effective tools for gene transfer and integrate variable numbers of proviral DNA copies in variable proportions of cells. The levels of transduction of a cellular population may therefore depend upon experimental parameters affecting the frequency and/or the distribution of vector integration events in this population. Such analysis would require measuring vector copy numbers (VCN) in individual cells. To evaluate the transduction of hematopoietic progenitor cells at the single-cell level, we measured VCN in individual colony-forming cell (CFC) units, using an adapted quantitative PCR (Q-PCR) method. The feasibility, reproducibility and sensitivity of this approach were tested with characterized cell lines carrying known numbers of vector integration. The method was validated by correlating data in CFC with gene expression or with calculated values, and was found to slightly underestimate VCN. In spite of this, such Q-PCR on CFC was useful to compare transduction levels with different infection protocols and different vectors. Increasing the vector concentration and re-iterating the infection were two different strategies that improved transduction by increasing the frequency of transduced progenitor cells. Repeated infection also augmented the number of integrated copies and the magnitude of this effect seemed to depend on the vector preparation. Thus, the distribution of VCN in hematopoietic colonies may depend upon experimental conditions including features of vectors. This should be carefully evaluated in the context of ex vivo hematopoietic gene therapy studies.


Figures

Figure 1
Figure 1
Characterization of the HT4-A, HT4-A2 and HT4-A6 clones. (a) Southern Blot on XbaI-digested genomic DNA from the HT1080 clones. The probes bands are the XbaI fragments released from an internal region to the vector and the flanking genomic DNA. (b) Correlation between VCN obtained by Q-PCR and MFI obtained by flow cytometry in the three clones.
Figure 2
Figure 2
Determination of VCN by Q-PCR. (a) The sensitivity of the Q-PCR was evaluated by measuring CT values (average of duplicate measures) for the amplification of the albumin gene sequences in decreasing numbers of control cells. Q-PCR was carried out from 1/6 of the total genomic DNA extracted from 500–50 000 cells. (b) VCN in the HT4-A, HT4-A2 and HT4-A6 clones were measured after proteinase K lysis extractions of separate preparations of cells ranging from 500–50 000 cells per condition. The Q-PCR was performed on 1/6 of the extracted genomic DNA as in Figure 2a. The control indicated on the right side of the graph corresponds to Q-PCR on genomic DNA obtained from 1 × 10⁶ cells extracted with a commercial Promega kit. (c) Comparison of VCN values obtained on the three clones using genomic DNA extracted either by proteinase K lysis from a number of cells inferior to 5 × 10⁴ or using a commercial kit and 1 × 10⁶ cells per extraction. (d) Comparison of VCN values obtained by Q-PCR from the three clones using genomic DNA extracted by proteinase K lysis in the presence (5 μl per condition) or absence of methylcellulose.
Figure 3
Figure 3
Correlation between GFP-positive CFC observed by microscopy and vector-positive CFC evaluated by Q-PCR (n=13 experiments).
Figure 4
Figure 4
(a) Transduction of CD34+ cells with increasing concentrations of a GFP-LV tested from 0.1 to 10 × 107 IG ml−1 in eight independent experiments. Results show the mean average VCN determined on the cells expanded in liquid culture in the presence of cytokines for 2 weeks after genomic DNA kit extraction (mean±s.d.). (b) Correlation between average VCN and the frequency of GFP expression measured by FACS in 40 experiments in which various GFP-LV vector concentrations were tested.
Figure 5
Figure 5
Effects of experimental conditions on the frequency of transduction and on the distribution of vector copies in the population. CFC with VCN values comprised between 0 and 0.1 were categorized as 0; those comprised between 0.1 and 1.1 were categorized as 1; those comprised between 1.2 and 2.1 were categorized as 2 and those with VCN superior to 2.1 were categorized as >2. Bars represent average percentage of CFC in each category over the total number of CFC analyzed. The number of CFC analyzed is indicated between brackets for each graph. (a) Transduction with an ultracentrifuged GFP-LV using various concentrations of vector. Results represent data pooled from three separate transduction experiments. (b) Transduction with an ultracentrifuged WASP-LV using several concentrations of vectors and either one or two consecutive infections (hits). Results represent data pooled from two separate transduction experiments. (c) Transduction with the GFP-LV at concentration of 2 × 10⁸ IG ml−1 given once or twice. Results represent data pooled from two separate transduction experiments. (d) Transduction with two batches of chromatography purified WASP-LV using two concentrations. Data from one experiment.
Figure 6
Figure 6
Distribution of the VCN in the different type of the CFC (CFU-GM, CFU-mix and BFU-E) from CD34+ cells transduced by (a) GFP-LV or (b) by WASP-LV.

References

    1. Fischer A, Cavazzana-Calvo M. Gene therapy of inherited diseases. Lancet. 2008;371:2044–2047. - PubMed
    1. Piacibello W, Bruno S, Sanavio F, Droetto S, Gunetti M, Ailles L, et al. Lentiviral gene transfer and ex vivo expansion of human primitive stem cells capable of primary, secondary, and tertiary multilineage repopulation in NOD/SCID mice. Nonobese diabetic/severe combined immunodeficient. Blood. 2002;100:4391–4400. - PubMed
    1. Enssle J, Trobridge GD, Keyser KA, Ironside C, Beard BC, Kiem HP. Stable marking and transgene expression without progression to monoclonality in canine long-term hematopoietic repopulating cells transduced with lentiviral vectors. Hum Gene Ther. 2010;21:397–403. - PMC - PubMed
    1. Woods NB, Fahlman C, Mikkola H, Hamaguchi I, Olsson K, Zufferey R, et al. Lentiviral gene transfer into primary and secondary NOD/SCID repopulating cells. Blood. 2000;96:3725–3733. - PubMed
    1. Cartier N, Hacein-Bey-Abina S, Bartholomae CC, Veres G, Schmidt M, Kutschera I, et al. Hematopoietic stem cell gene therapy with a lentiviral vector in X-linked adrenoleukodystrophy. Science. 2009;326:818–823. - PubMed