. 2010 Dec 2:4:215.
doi: 10.3389/fnhum.2010.00215. eCollection 2010.

Attention, uncertainty, and free-energy

Affiliations

Attention, uncertainty, and free-energy

Harriet Feldman et al. Front Hum Neurosci. .

Abstract

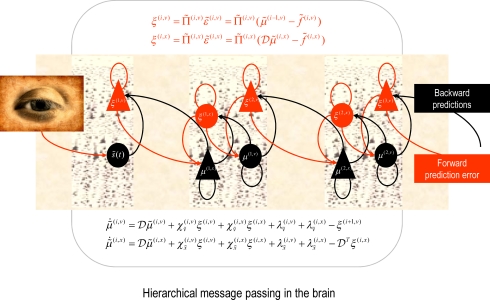
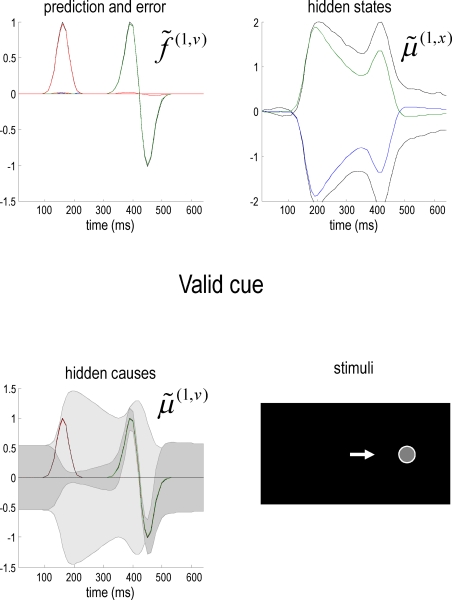
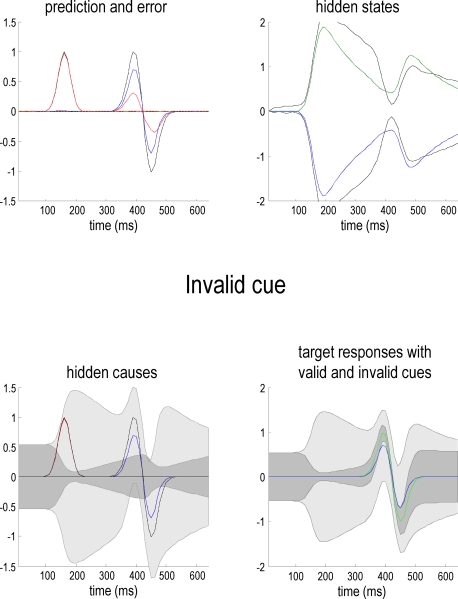
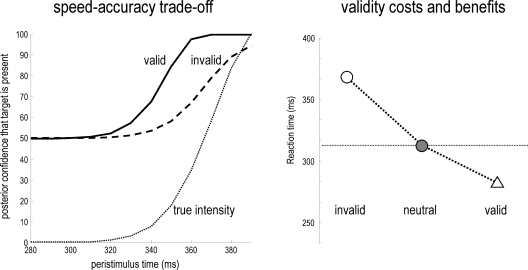
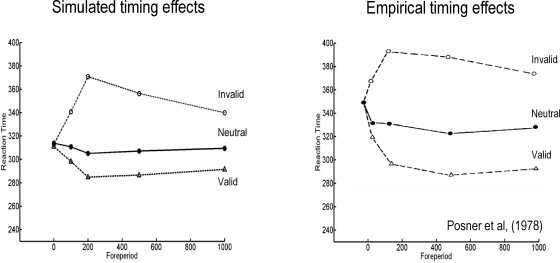
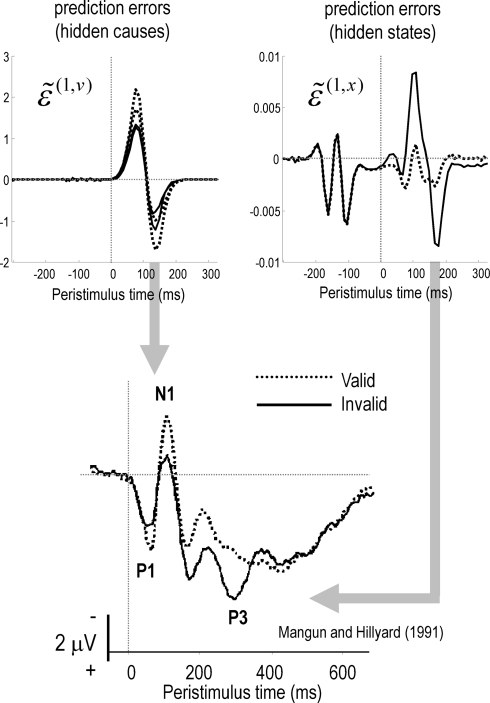
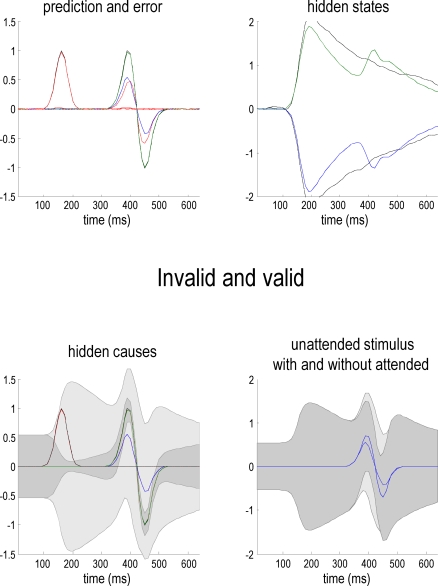
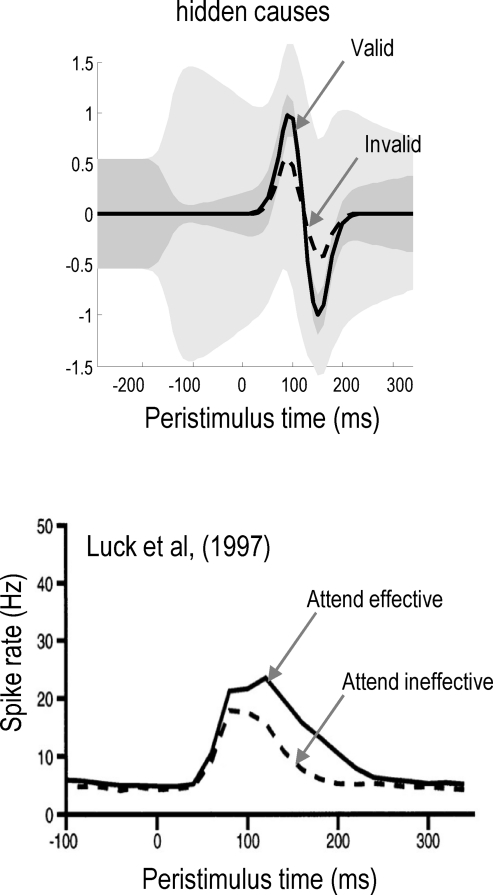
We suggested recently that attention can be understood as inferring the level of uncertainty or precision during hierarchical perception. In this paper, we try to substantiate this claim using neuronal simulations of directed spatial attention and biased competition. These simulations assume that neuronal activity encodes a probabilistic representation of the world that optimizes free-energy in a Bayesian fashion. Because free-energy bounds surprise or the (negative) log-evidence for internal models of the world, this optimization can be regarded as evidence accumulation or (generalized) predictive coding. Crucially, both predictions about the state of the world generating sensory data and the precision of those data have to be optimized. Here, we show that if the precision depends on the states, one can explain many aspects of attention. We illustrate this in the context of the Posner paradigm, using the simulations to generate both psychophysical and electrophysiological responses. These simulated responses are consistent with attentional bias or gating, competition for attentional resources, attentional capture and associated speed-accuracy trade-offs. Furthermore, if we present both attended and non-attended stimuli simultaneously, biased competition for neuronal representation emerges as a principled and straightforward property of Bayes-optimal perception.

Keywords: attention; biased competition; free-energy; generative models; perception; precision; predictive coding.


Figures

Figure 1
Figure 1
Schematic detailing the neuronal architecture that might implement the generalized predictive coding described in Eq. 16. This shows the speculative cells of origin of forward driving connections that convey prediction error from a lower area to a higher area and the backward connections that construct predictions (Mumford, ; Friston, 2008). These predictions try to explain away prediction error in lower levels. In this scheme, the sources of forward and backward connections are superficial and deep pyramidal cells respectively. The equations represent a gradient descent on free-energy under a hierarchical dynamic model (see Eq. 16). State-units are in black and error-units in red. Here, neuronal populations are deployed hierarchically within three cortical areas (or macro-columns). Subscripts denote derivatives.
Figure 2
Figure 2
Simulation of the Posner task (validly cued target). Upper left panel: the time-dependent expression of the cue and target stimuli are shown as broken gray lines, while the respective predictions are in red sC and green sL respectively. The dotted red lines show the prediction error and reflect the small amount of noise we used in these simulations. Lower left panel: the ensuing conditional expectations of the underlying hidden causes vR(1),vC(1),vL(1) are shown below. The gray areas correspond to 90% conditional confidence tubes; this confidence reflects the estimated precision of the sensory data, which is encoded by the expectations of the hidden states in the upper right panel. The green line corresponds to a precision or attentional bias to the right xR(1) and the blue line to the left xL(1). They gray lines are the true precisions. Lower right panel: this insert indicates the sort of stimuli that would be generated by these hidden causes.
Figure 3
Figure 3
This figure uses the same format as Figure 2 but shows responses to an invalid target (blue line) presented on the right. The predictions of this sensory channel are substantially less than the true value (compare the blue and dotted gray lines) with a consequent expression of prediction error (dotted red line). The conditional confidence regions for the conditional expectation of this invalid target (lower left panel) are now much larger than in the previous figure. This is shown in the lower right panel, where one can compare the conditional estimates of the valid (green; see Figure 2) and the invalid (blue) hidden cause, with their respective conditional confidences (gray). Note that these responses were elicited using exactly the same stimulus amplitude.
Figure 4
Figure 4
Left panel: the posterior probability of a target being present as a function of peristimulus time, which can be interpreted in terms of a speed-accuracy trade-off. A reaction time can be derived from this data, as the post-stimulus time taken to achieve a fixed level of accuracy, as determined by the posterior or conditional confidence. In this example, 80% conditional confidence is attained at about 340 ms for valid targets (solid line). However, for invalid targets (broken line) the same accuracy is only attained after about 360 ms. This translates into a reaction time advantage for valid targets of about 20 ms. Right panel: this shows the reaction times for invalid, neural and valid cues, where neutral cues caused a small reduction in precision but with no spatial bias. The reaction times here are shown to within an additive constant, to better reflect empirical data (see Figure 5).
Figure 5
Figure 5
Left panel: simulated reaction times showing the time course of the Posner effect over different delays (foreperiod) between the onset of the cue and the target increases. Right panel: empirical reaction time data, redrawn from Posner et al. (1978). In both the simulated and empirical data, reaction time benefit and cost increase swiftly to a maximum and then decay slowly. This reflects the quick rise and slow decay of the inferred hidden states seen in Figures 2 and 3 (upper right panels). There is a slight reaction time benefit for neutral cues due to a temporal alerting effect. This was modeled by allowing neutral cues to induce a small rise in both the inferred hidden states. The simulated reaction times were taken as the time at which there was 80% confidence that the target was present. The simulated reaction times are shown to within an arbitrary constant (to accommodated unmodeled motor responses). The asymmetric difference between the cost for an invalid cue and the benefit for a valid cue is an emergent property of the simulations.
Figure 6
Figure 6
Simulated EEG data from our simulations (upper panels) and empirical EEG data (lower panel) from Mangun and Hillyard (1991). The EEG traces were created from the prediction errors on the hidden causes (left) and states (right). The empirical data were recorded via EEG from the occipital cortex contralateral to the target (i.e., the cortex processing the target). The simulated data exhibits two important features of empirical studies: early in peristimulus time, stimulus-driven responses are greater for valid cues (upper left panel) relative to invalid cues. This is often attributed to a validity enhancement of early (e.g., N1) components. Conversely, later in peristimulus time, invalid responses are greater in amplitude. This can be related to novelty (and salience) responses usually associated with late waveform components (e.g., P3). In the simulations, this invalidity effect is explained simply by greater prediction errors on inferred hidden states encoding precision (upper right panel). It is these prediction errors that report a surprising or novel context, following the failure to predict invalidly cued stimuli in an optimal fashion.
Figure 7
Figure 7
This figure uses the same format as Figures 2 and 3 but reports the results when both targets are presented simultaneously. The ensuing conditional responses can be compared with the responses in Figure 3, when the invalidly cued target was presented alone: when the valid target is also presented, it prevents the invalid target from reversing the precision bias established by the cue; i.e., it fails to capture attention resources. The lower right panel shows the conditional expectation and confidence regions for the invalid target, with and without the valid target, to show how the responses evoked are suppressed; i.e., biased competition.
Figure 8
Figure 8
This figure demonstrates how generalized predictive coding reproduces some quantitative aspects of biased competition. The simulation (upper panel) reproduces the conditional expectations in the previous figure about valid (solid line) and invalid (dashed line) targets, when presented simultaneously. These two responses resemble those reported in Luck et al. (1997). Lower panel: peristimulus histograms (over 20 ms bins) redrawn from Luck et al. (1997), following simultaneous presentation of two (effective and ineffective) stimuli averaged over 29 V4 neurons that showed a significant attention effect. The solid line reports trials in which attention was directed to the effective stimulus (cf, responses to a valid target) and the dashed line when attention was directed to the ineffective stimulus (cf, responses to an invalid target). Note that the empirical data are non-negative spike counts, whereas the simulated activity represent firing rate deviations around baseline levels.

References

    1. Adams W. J., Graf E. W., Ernst M. O. (2004). Experience can change the ‘light-from-above’ prior. Nat. Neurosci. 7, 1057–1058 - PubMed
    1. Alais D., Burr D. (2004). The ventriloquist effect results from near-optimal bimodal integration. Curr. Biol. 14, 257–262 - PubMed
    1. Anderson A. J., Carpenter R. H. S. (2006). Changes in expectation consequent on experience, modeled by a simple, forgetful neural circuit. J. Vis. 6, 822–835 - PubMed
    1. Baldi P., Itti L. (2010). Of bits and wows: a Bayesian theory of surprise with applications to attention. Neural Netw. 23, 649–66610.1016/j.neunet.2009.12.007 - DOI - PMC - PubMed
    1. Ballard D. H., Hinton G. E., Sejnowski T. J. (1983). Parallel visual computation. Nature 306, 21–2610.1038/306021a0 - DOI - PubMed

LinkOut - more resources