. 2011 Jun;30(3):759-78.
doi: 10.1007/s10827-010-0291-y. Epub 2010 Dec 15.

Non-linear stimulus-response behavior of the human stance control system is predicted by optimization of a system with sensory and motor noise

Affiliations

Non-linear stimulus-response behavior of the human stance control system is predicted by optimization of a system with sensory and motor noise

Herman van der Kooij et al. J Comput Neurosci. 2011 Jun.

Abstract

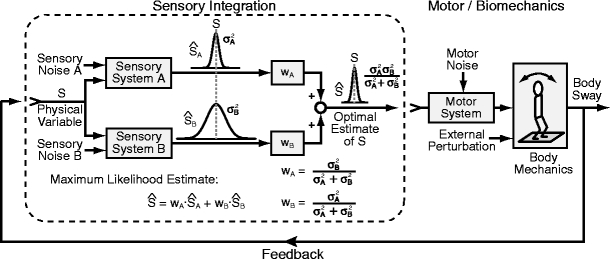
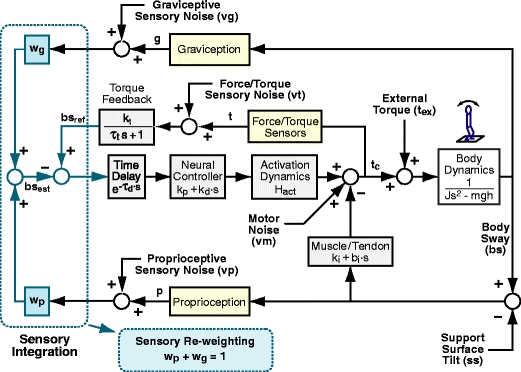
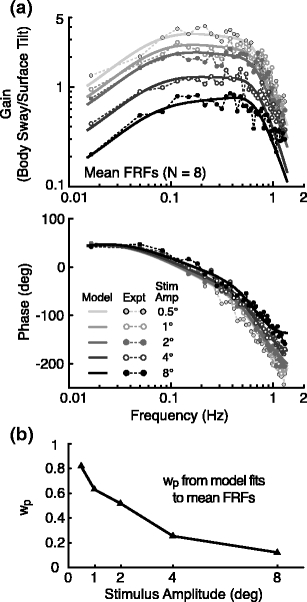
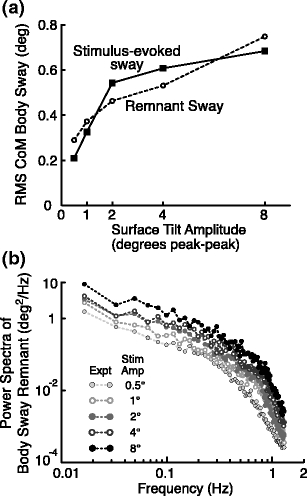
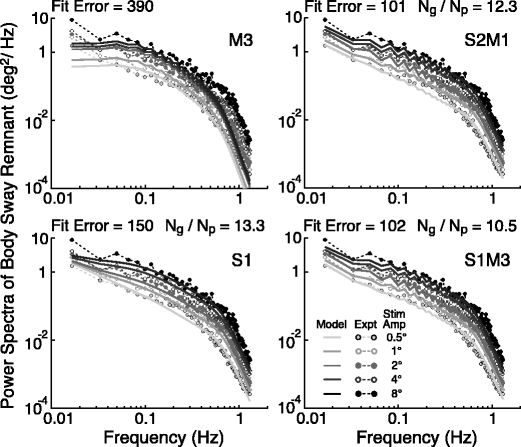
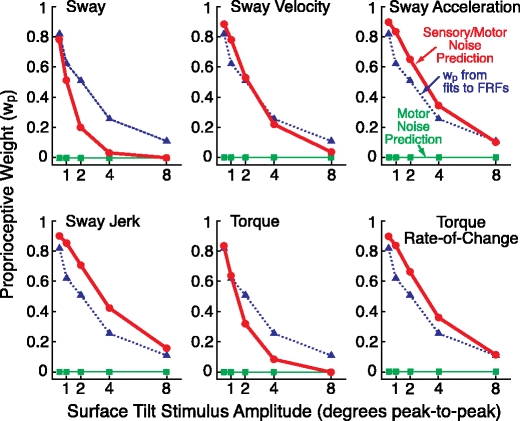
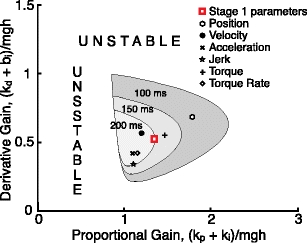
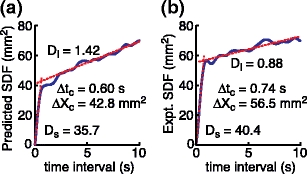
We developed a theory of human stance control that predicted (1) how subjects re-weight their utilization of proprioceptive and graviceptive orientation information in experiments where eyes closed stance was perturbed by surface-tilt stimuli with different amplitudes, (2) the experimentally observed increase in body sway variability (i.e. the "remnant" body sway that could not be attributed to the stimulus) with increasing surface-tilt amplitude, (3) neural controller feedback gains that determine the amount of corrective torque generated in relation to sensory cues signaling body orientation, and (4) the magnitude and structure of spontaneous body sway. Responses to surface-tilt perturbations with different amplitudes were interpreted using a feedback control model to determine control parameters and changes in these parameters with stimulus amplitude. Different combinations of internal sensory and/or motor noise sources were added to the model to identify the properties of noise sources that were able to account for the experimental remnant sway characteristics. Various behavioral criteria were investigated to determine if optimization of these criteria could predict the identified model parameters and amplitude-dependent parameter changes. Robust findings were that remnant sway characteristics were best predicted by models that included both sensory and motor noise, the graviceptive noise magnitude was about ten times larger than the proprioceptive noise, and noise sources with signal-dependent properties provided better explanations of remnant sway. Overall results indicate that humans dynamically weight sensory system contributions to stance control and tune their corrective responses to minimize the energetic effects of sensory noise and external stimuli.


Figures

Fig. 1
Fig. 1
Schematic depiction of the stance control system and factors potentially influencing its control. Considering the sensory integration component of the system in isolation (system in the dashed box), Bayesian estimation theory shows that optimal sensory weights can be determined that provide a maximum likelihood estimate of a physical variable if the variances of the different sensory signals are known. However, unlike simpler systems that involve only sensory integration, the feedback structure of the stance control systems causes the variability of a particular sensory signal to be influenced by intrinsic noise in all sensory systems and by motor noise, external perturbations, and the dynamic characteristics of the overall system which in turn are related to the combined influence of the sensory-integration process, the sensory-to-motor transformation, neuro-muscular dynamics, and biomechanics
Fig. 2
Fig. 2
Model of human stance control in which sensory information from proprioceptive and graviceptive systems is weighted (w p and w g) to provide an estimate of body-in-space sway angle, bs est. However, bs est is potentially biased from true body-in-space orientation due to sustained perturbations such as stance on a tilted surface. The model provides a mechanism based on feedback from a low-pass filtered torque signal, t, to drive body motion in a direction that reduces the corrective torque necessary to maintain stance. This torque feedback mechanism can be thought of as providing a slowly time-varying internal reference signal, bs ref, for comparison with bs est. The difference between bs ref and bs est is fed through a time delay, neural controller, and second order activation dynamics to produce a corrective torque, t c, that stabilizes human stance. The different neural feedback pathways are affected by sensory noise (vg, vt, and vp). In addition motor noise, vm, adds variability to the corrective torque. Besides the neural feedback pathways, intrinsic muscle/tendon dynamics contribute to the stabilizing corrective torque. Muscle/tendon dynamics are represented by a spring (k i) and damper (b i). Transfer function equations for this model and model components are given in Appendix B
Fig. 3
Fig. 3
Results of the Stage 1 analysis. (a) Gain (upper graph) and phase (lower) of the mean experimental frequency response functions, FRFs, (points connected by dotted lines) and model fitted transfer functions (solid lines) of surface tilt to body sway for the five different stimulus amplitudes. The proprioceptive weight parameters, w p, were allowed to vary over experimental conditions. Graviceptive weights, w g, also varied but were linked to w p values such that w g = 1-w p. The model-fitted parameters that were constant over the five stimulus amplitudes were joint stiffness (k i = 40.5 Nm/rad) and damping (b i = 68.8 Nms/rad), the neural controller proportional (k p = 943.9 Nm/rad) and derivative (k d = 313.5 Nms/rad) gains, the lumped neural time delay (τ d = 0.097 s), and the gain (k t = 0.0018 rad/Nm) and time constant (τ t = 17.4 s) of the low-pass filter of the torque feedback loop. (b) The model-fitted proprioceptive weights decreased with increasing stimulus amplitude and accounted for the systematic decrease in gain with increasing stimulus amplitude
Fig. 4
Fig. 4
(a) The body-sway variability can be decomposed into a part that is evoked by the stimulus and into the remnant sway that is not directly attributable to the applied stimulus (Appendix A). Both the experimental stimulus-evoked and remnant body sway increased with stimulus amplitude (mean values across the 8 subjects are shown). (b) The power spectral density of the body sway remnant decreased with increasing frequency and increased with increasing stimulus amplitude. At the excited frequencies (the odd-harmonic frequencies of the fundamental 0.017 Hz frequency), the power was typically higher than at the adjacent non-excited, even-harmonic frequencies
Fig. 5
Fig. 5
Results of the Stage 2 analysis. Examples of different noise model predictions of remnant power spectra for models with sensory only, motor only, or combinations of sensory and motor noise. The model predictions were derived from noise model fits to the remnant power spectra across the 5 stimulus amplitudes using control model parameters derived from the Stage 1 analysis. The fit error and the ratio between graviceptive and proprioceptive noise are shown for each noise model
Fig. 6
Fig. 6
Results of the Stage 3 analysis. Comparison of the experimental proprioceptive weights, w p, (from Stage 1 analysis, triangles connected by dotted lines) and w p values (dots connected by thick lines) predicted by different behavioral criteria based on the minimization of the sum of mean-square value of body sway, sway velocity, sway acceleration, sway jerk, corrective torque, or the torque rate-of-change. The w p predictions were based on the S1M3 remnant noise model. Predictions of w p were uniformly zero for all motor-only noise models (M1, M2, or M3, squares connected by thin lines)
Fig. 7
Fig. 7
Results of the Stage 4 analysis. The shaded areas indicate the derivative (combination of neural controller k d and intrinsic damping b i) and proportional (combination of neural controller k p and intrinsic stiffness k i) gains for which the stance control model was stable. Both the derivative and proportional gains are normalized by the gravitational stiffness mgh. The area of stable operation decreases when the time delay increases. The square symbol denotes the gains derived from the Stage 1 analysis of experimental data. The other symbols indicate the neural controller plus intrinsic visco-elastic gains predicted by minimizing different behavioral criteria using the S1M3 remnant noise model. The experimentally derived gains are in between the predictions made by minimization of torque and velocity criteria
Fig. 8
Fig. 8
Results of the Stage 5 analysis. Shown are the stabilogram diffusion functions, SDFs, and their diffusion coefficients (short term, D s, and long term, D l) derived from linear fits (dotted lines) to the SDFs, and critical coordinates (critical time, Δt c, and displacement, ΔX c) determined by the intersection of both linear fits. The model-predicted SDF (a) was close to the experimentally estimated SDF derived from eyes-closed, quiet stance data of the same subjects (b)

References

    1. Albert R, Barabási AL. Statistical mechanics of complex networks. Reviews of Modern Physics. 2002;74:47–97. doi: 10.1103/RevModPhys.74.47. - DOI
    1. Angelaki DE, McHenry MQ, Dickman JD, Newlands SD, Hess BJ. Computation of inertial motion: Neural strategies to resolve ambiguous otolith information. Journal of Neuroscience. 1999;19:316–327. - PMC - PubMed
    1. Bendat JS, Piersol AG. Random Data: Analysis and Measurement Procedures. New York: John Wiley & Sons, Inc.; 2000.
    1. Bosco G, Eian J, Poppele RE. Kinematic and non-kinematic signals transmitted to the cat cerebellum during passive treadmill stepping. Experimental Brain Research. 2005;167:394–403. doi: 10.1007/s00221-005-0033-y. - DOI - PubMed
    1. Carpenter M, Frank J, Winter D, Peysar G. Sampling duration effects on centre of pressure summary measures. Gait & Posture. 2001;13:35–40. doi: 10.1016/S0966-6362(00)00093-X. - DOI - PubMed

Publication types

MeSH terms

LinkOut - more resources