

Dosimetry of 18F-labeled tyrosine kinase inhibitor SKI-249380, a dasatinib-tracer for PET imaging
- PMID: 21161687
- PMCID: PMC3113455
- DOI: 10.1007/s11307-010-0462-2
Dosimetry of 18F-labeled tyrosine kinase inhibitor SKI-249380, a dasatinib-tracer for PET imaging
Abstract
Purpose: To obtain estimates of human normal-organ radiation doses of ¹⁸F-SKI-249380, as a prerequisite step towards first-in-human trial. ¹⁸F-SKI-249380 is a first-of-its-kind PET tracer for imaging the in vivo pharmacokinetics of dasatinib, an investigational targeted therapy for solid malignancies.
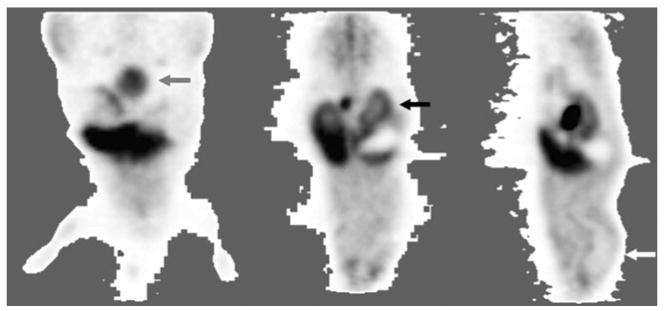
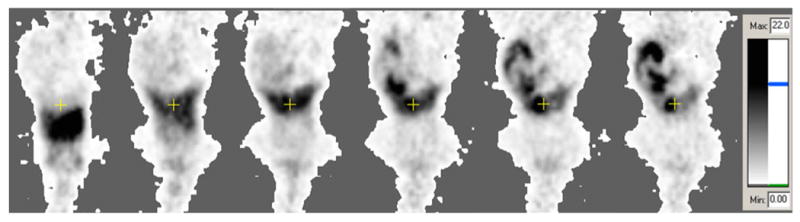
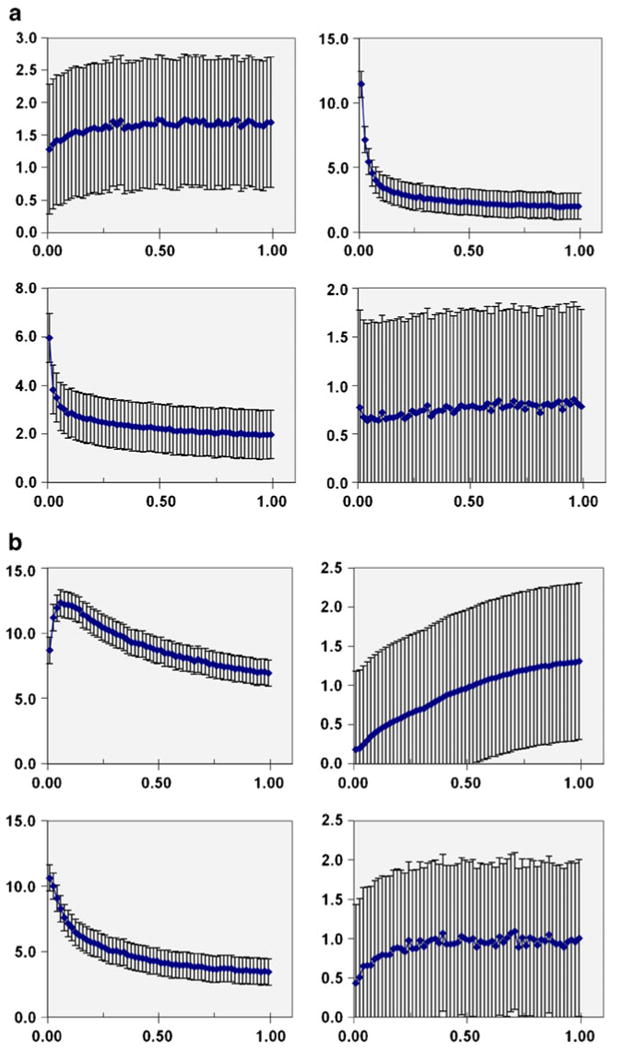
Procedures: Isoflurane-anesthetized mice received tracer dose via tail vein. Organ time-integrated activity coefficients, fractional urinary and hepatobiliary excretion, and total-body clearance kinetics were derived from PET data, with allometric extrapolation to the Standard Man anatomic model and normal-organ-absorbed dose calculations using OLINDA/EXM software.
Results: The human effective dose was 0.031 mSv/MBq. The critical organ was the upper large intestine, with a dose equivalent of 0.25 mSv/MBq. A 190-MBq administered activity of ¹⁸F-SKI-249380 is thus predicted to expose an adult human to radiation doses generally comparable to those of routinely used diagnostic radiopharmaceuticals.
Conclusions: Animal-based human dose estimates support first-in-human testing of ¹⁸F-SKI-249380.
Conflict of interest statement
Figures
References
-
- Luo FR, Barrett Y, Ji P, et al. Dasatinib (BMS-354825) pharmacokinetics correlate with pSRC pharmacodynamics in phase I studies of patients with cancer (CA180002, CA180003) J Clin Oncol. 2006;24(suppl):3046.
-
- U.S. National Institutes of Health 2010. [11 June 2010]. Available at: http://clinicaltrials.gov/ - PubMed
-
- Demetri GD, Lo Russo P, MacPherson IRJ, et al. Phase I dose-escalation and pharmacokinetic study of dasatinib in patients with advanced solid tumors. Clin Cancer Res. 2009;15:6232–6240. - PubMed
-
- Wang L, Christopher LJ, Cui D, et al. Identification of the human enzymes involved in the oxidative metabolism of dasatinib: an effective approach for determining metabolite formation kinetics. Drug Metab Dispos. 2008;36:1828–1839. - PubMed
-
- Veach DR, Namavari M, Pillarsetty N, et al. Synthesis and biological evaluation of a fluorine-18 derivative of dasatinib. J Med Chem. 2007;50:5853–5857. - PubMed
Publication types
MeSH terms
Substances
Grants and funding
LinkOut - more resources
Full Text Sources
