. 2011 Mar 7;272(1):131-40.
doi: 10.1016/j.jtbi.2010.11.042. Epub 2010 Dec 14.

Pathway analysis of liver metabolism under stressed condition

Affiliations

Pathway analysis of liver metabolism under stressed condition

Mehmet A Orman et al. J Theor Biol. .

Abstract

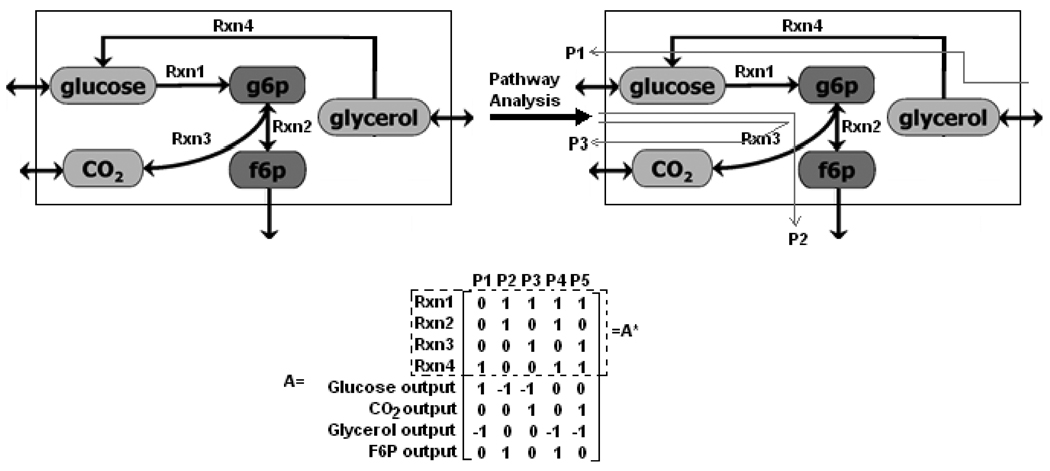
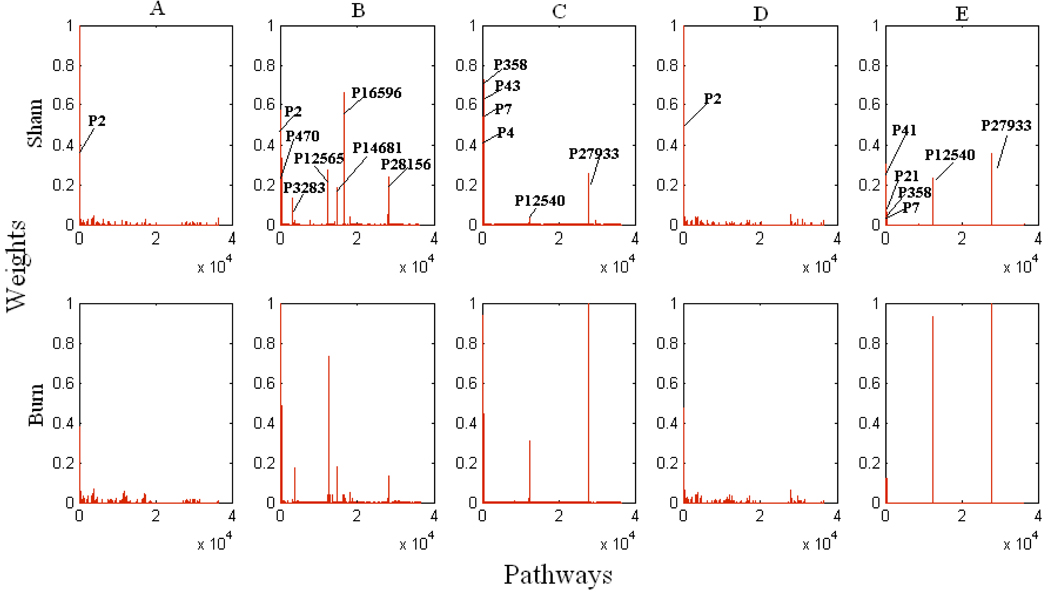
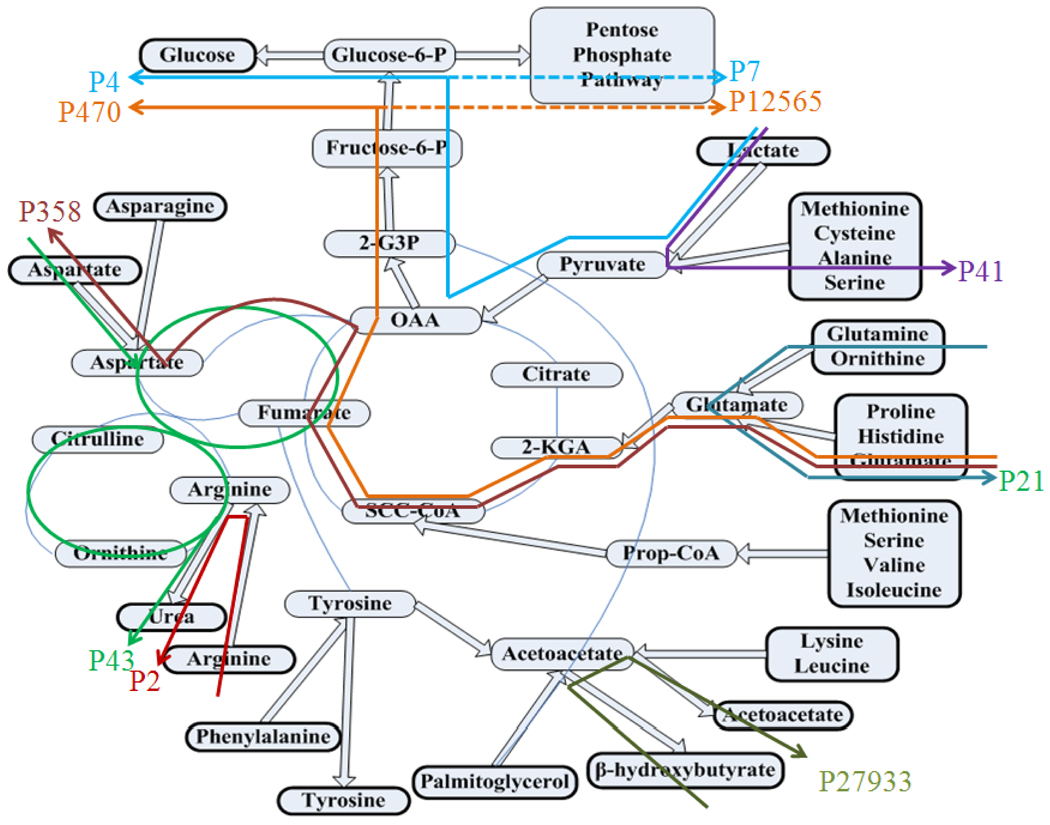
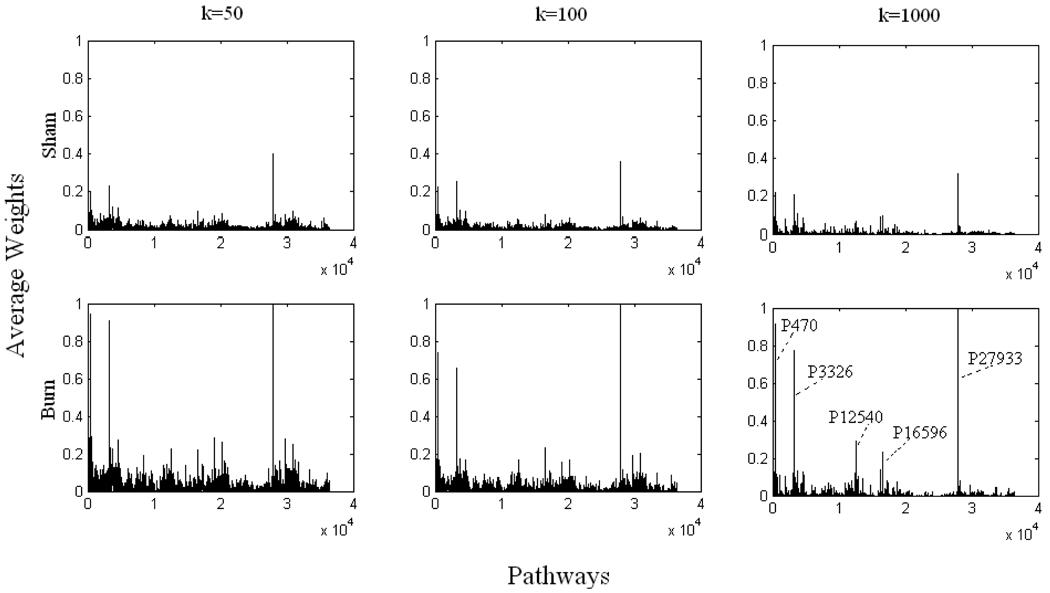
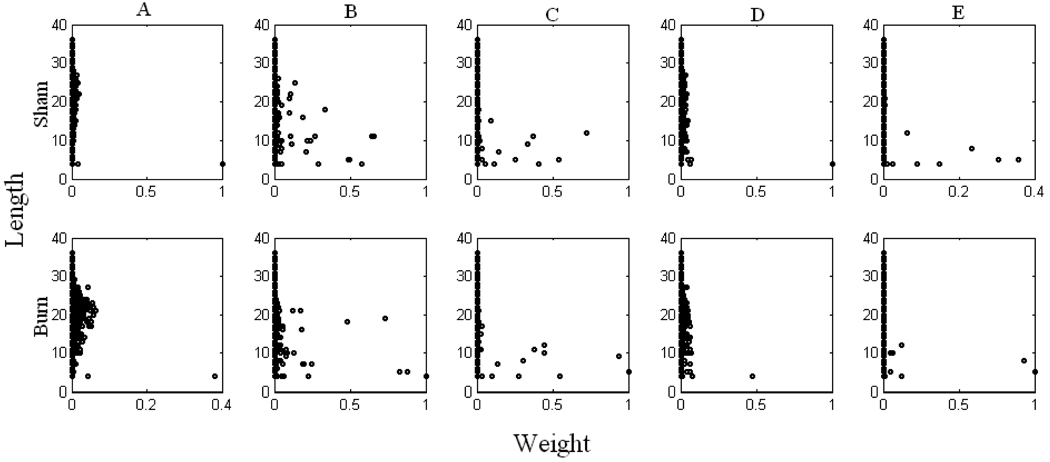
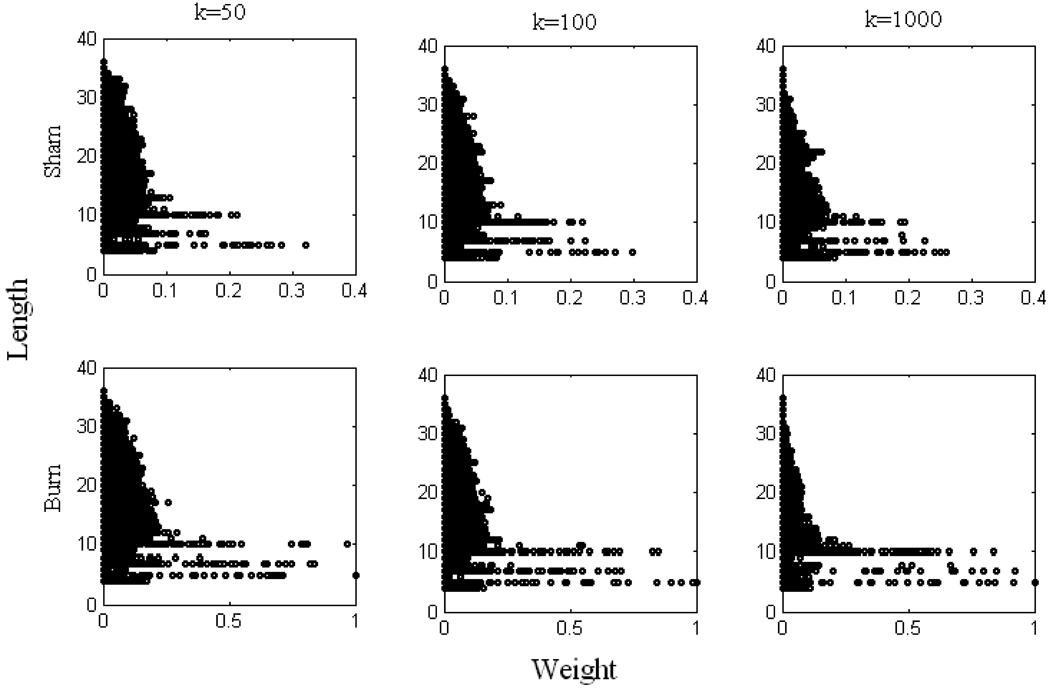
Pathway analysis is a useful tool which reveals important metabolic network properties. However, the big challenge is to propose an objective function for estimating active pathways, which represent the actual state of network. In order to provide weight values for all possible pathways within the metabolic network, this study presents different approaches, considering the structural and physiological properties of the metabolic network, aiming at a unique decomposition of the flux vector into pathways. These methods were used to analyze the hepatic metabolism considering available data sets obtained from the perfused livers of fasted rats receiving burn injury. Utilizing unique decomposition techniques and different fluxes revealed that higher weights were always attributed to short pathways. Specific pathways, including pyruvate, glutamate and oxaloacetate pools, and urea production from arginine, were found to be important or essential in all methods and experimental conditions. Moreover the pathways, including serine production from glycine and conversion between acetoacetate and B-OH-butyrate, were assigned higher weights. Pathway analysis was also used to identify the main sources for the production of certain products in the hepatic metabolic network to gain a better understanding of the effects of burn injury on liver metabolism.


Figures

Figure 1
Figure 1. Metabolic pathway analysis of a simple network
Five different elementary modes are identified for the simple network in matrix form A where rows represent the reactions and columns indicate the modes. A* is matrix of elementary modes including only internal reactions.
Figure 2
Figure 2. Weight values of pathways
Panels in the first row represent the sham data, and the second row the burn data. Panels in each column indicates different method: A) Minimizing the length of weight vector, B) Maximizing the entropy, C) Maximizing the number of pathways, D) Maximizing the activity of shortest pathways, E) Maximizing the activity of pathways including glucose and /or urea production. Weights of some pathways, P 358, P43, P7, and P4, which are not clear on the panels of column C, are respectively 0.72, 0.34, 0.02, and 0.01 after sham treatment, and 0.44, 0.93, 0.45, and 0.02 after the burn treatment. Weights of P41, P21, P358, and P7 on the panels of column E are respectively 0.30, 0.08, 0.12, and 0.001 after sham treatment, and 0.05, 0.12, 0.06, and 0.06 after burn treatment. Note that in each method all weights values are normalized according to largest one observed among the sham and burn results.
Figure 3
Figure 3. Some important pathways (frequently observed at all methods and experimental conditions) on a simplified hepatic metabolic network
Lactate enters P4 and P7 to produce glucose or to go into PPP. Similarly, glutamine is also used for glucose production (P470), aspartate (P358) or PPP (P12565). P43 shows the conversion of aspartate to urea. There are also pathways where conversion of lactate to cysteine and alanine (P41); and glutamine to glutamate (P21) take place. P2 includes arginine uptake, formation and secretion of ornithine and urea. P27933 are related to ketone bodies where conversion between acetoacetate and B-OH-butyrate by B-OH-butyrate dehydrogenise is seen. Note that external metabolites are given in bold boxes.
Figure 4
Figure 4. Average weights obtained from problem (13)
Panels in each column represent different k. Panels in the first row correspond to sham data, and the second row burn data. Some important pathways which are always observed with higher weights are shown on the figure (see text for details). Note that at different k, all weights values are normalized according to largest one observed among the sham and burn results.
Figure 5
Figure 5. The relation between weight value and pathway length
Panels in the first row represent the sham data, and the second row the burn data. Panels in each column indicates different method: A) Minimizing the length of weight vector, B) Maximizing the entropy, C) Maximizing the number of pathways, D) Maximizing the activity of shortest pathways, E) Maximizing the activity of pathways including glucose and /or urea production. Note that in each method all weights values are normalized according to largest one observed among the sham and burn results.
Figure 6
Figure 6. The relation between weight value and pathway length obtained from problem (13)
Panels in each column represent different k. Panels in the first row correspond to sham data, and the second row burn data. Note that at different k, all weights values are normalized according to largest one observed among the sham and burn results.

References

    1. Arai K, Lee K, Berthiaume F, Tompkins RG, Yarmush ML. Intrahepatic amino acid and glucose metabolism in a D-galactosamine-induced rat liver failure model. Hepatology. 2001;34:360–371. - PubMed
    1. Banta S, Yokoyama T, Berthiaume F, Yarmush ML. Effects of dehydroepiandrosterone administration on rat hepatic metabolism following thermal injury. J Surg Res. 2005;127:93–105. - PubMed
    1. Banta S, Vemula M, Yokoyama T, Jayaraman A, Berthiaume F, Yarmush ML. Contribution of gene expression to metabolic fluxes in hypermetabolic livers induced through burn injury and cecal ligation and puncture in rats. Biotechnol Bioeng. 2007;97:118–137. - PMC - PubMed
    1. Burgard AP, Maranas CD. Optimization-based framework for inferring and testing hypothesized metabolic objective functions. Biotechnol Bioeng. 2003;82:670–677. - PubMed
    1. Cakir T, Kirdar B, Ulgen KO. Metabolic pathway analysis of yeast strengthens the bridge between transcriptornics and metabolic networks. Biotechnol Bioeng. 2004;86:251–260. - PubMed

Publication types

LinkOut - more resources