

Effects of ethanol on phosphorylation site mutants of recombinant N-methyl-D-aspartate receptors
- PMID: 21163614
- PMCID: PMC3095724
- DOI: 10.1016/j.alcohol.2010.08.015
Effects of ethanol on phosphorylation site mutants of recombinant N-methyl-D-aspartate receptors
Abstract
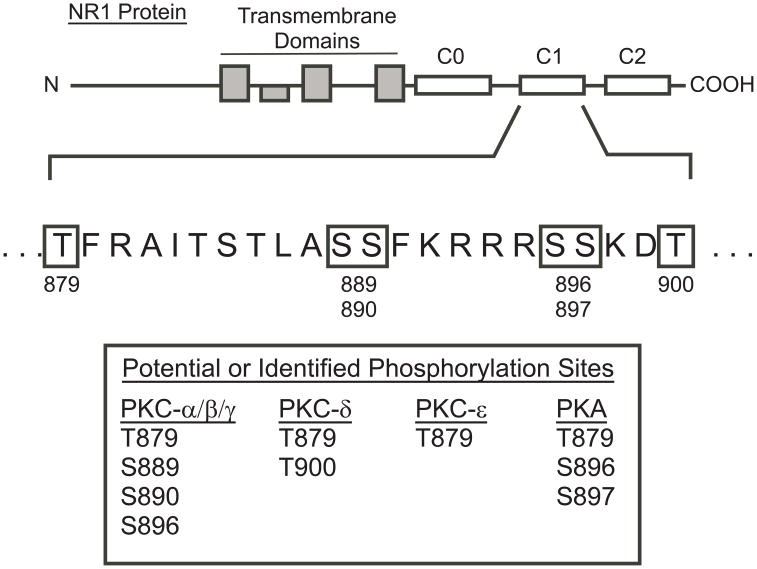
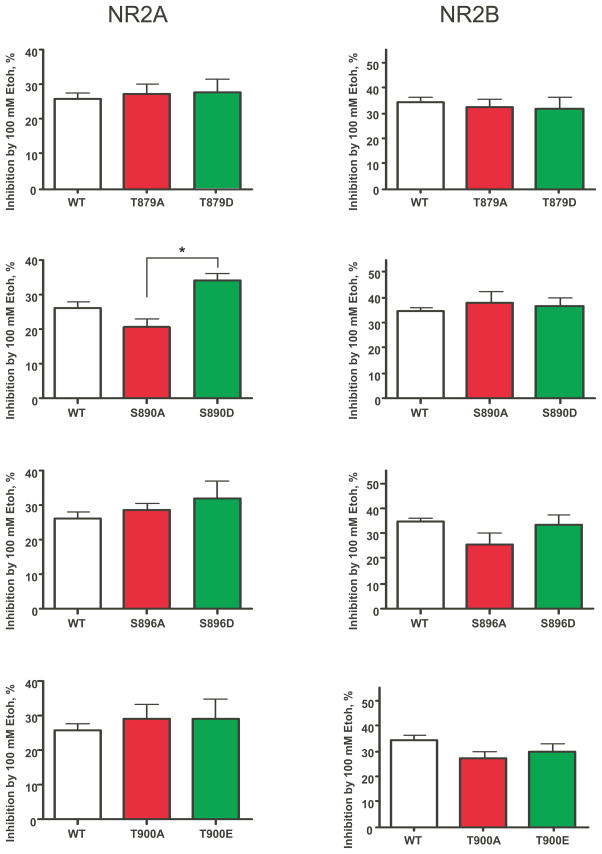
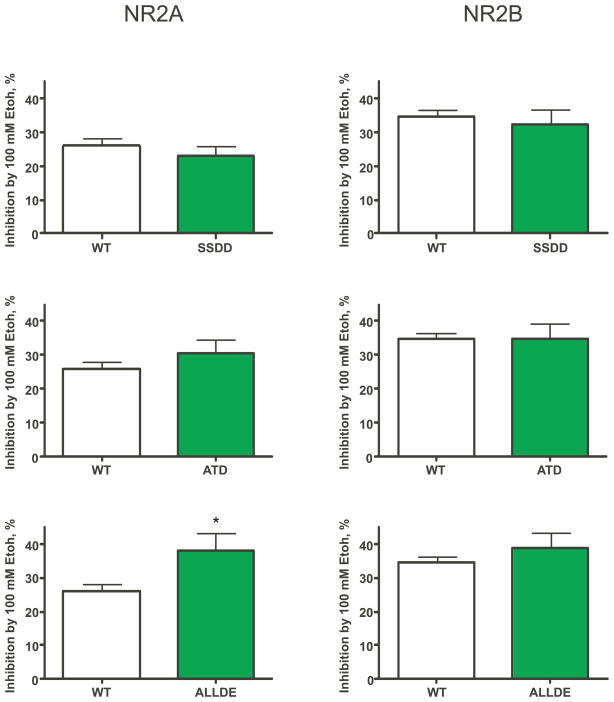
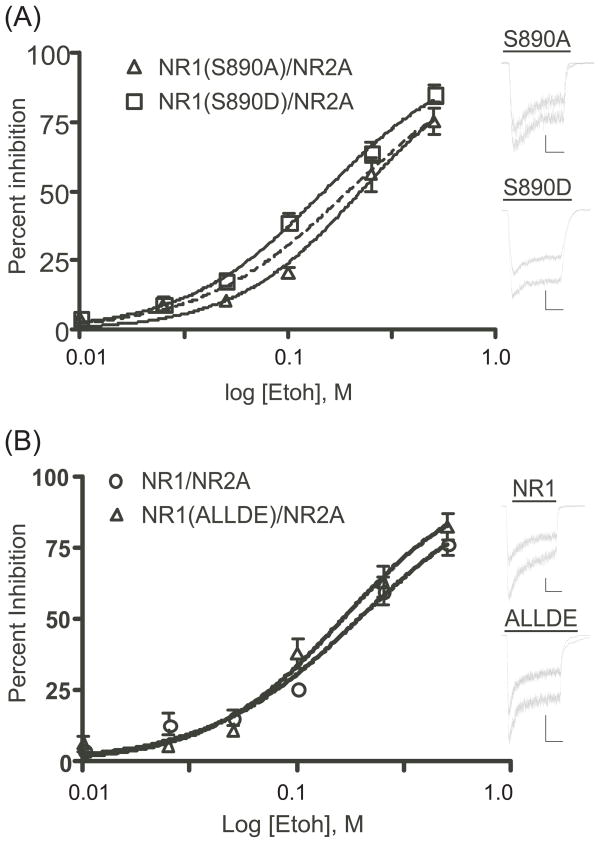
N-methyl-D-aspartate (NMDA) receptors are ligand-gated ion channels activated by the neurotransmitter glutamate. These channels are highly expressed by brain neurons and are critically involved in excitatory synaptic transmission. Results from previous studies show that both native and recombinant NMDA receptors are inhibited by ethanol at concentrations associated with signs of behavioral impairment and intoxication. Given the important role that NMDA receptors play in synaptic transmission and brain function, it is important to understand the factors that regulate the ethanol inhibition of these receptors. One dynamic mechanism for regulating ethanol action may be via phosphorylation of NMDA subunits by serine-threonine and tyrosine kinases. Both NR1 and NR2 subunits contain multiple sites of phosphorylation; and in the NR1 subunit, most of these are contained within the C1 domain, a carboxy-terminal cassette that is subject to alternative splicing. Although results from our previous studies suggest that single phosphorylation sites do not greatly affect ethanol sensitivity of NMDA receptors, it is likely that in vivo, these subunits are phosphorylated at multiple sites by different kinases. In the present study, we constructed a series of NMDA receptor mutants at serine (S) or threonine (T) residues proposed to be sites of phosphorylation by protein kinase A and various isoforms of protein kinase C. Ethanol (100mM) inhibited currents from wild-type NR1/2A and NR1/2B receptors expressed in human embryonic kidney 293 cells by approximately 25 and 30%, respectively. This inhibition was not different in single-site mutants expressing alanine (A) or aspartate/glutamate (D/E) at positions T879, S896, or T900. The mutant NR1(S890D) showed greater ethanol inhibition than NR1(890A) containing receptors, although this was only observed when it was combined with the NR2A subunit. Ethanol inhibition was not altered by aspartate substitution at four serines (positions 889, 890, 896, and 897) or when T879D was added to the four serine-substituted mutant. Ethanol inhibition was increased when T900E was added to the five serine-/threonine-substituted mutants, but again this was selective for NR2A containing receptors. Together with previously published data, these findings suggest that modification of putative phosphorylation sites could contribute to the overall acute ethanol sensitivity of recombinant NMDA receptors. Supported by R37AA009986.
Copyright © 2011 Elsevier Inc. All rights reserved.
Figures
Similar articles
-
Ethanol inhibition of NMDA receptors under conditions of altered protein kinase A activity.J Neurochem. 2006 Mar;96(6):1760-7. doi: 10.1111/j.1471-4159.2006.03703.x. J Neurochem. 2006. PMID: 16539691
-
Effects of amino acid substitutions in transmembrane domains of the NR1 subunit on the ethanol inhibition of recombinant N-methyl-D-aspartate receptors.Alcohol Clin Exp Res. 2006 Mar;30(3):523-30. doi: 10.1111/j.1530-0277.2006.00058.x. Alcohol Clin Exp Res. 2006. PMID: 16499494
-
Effects of c-Src tyrosine kinase on ethanol sensitivity of recombinant NMDA receptors expressed in HEK 293 cells.Alcohol Clin Exp Res. 1999 Feb;23(2):357-62. Alcohol Clin Exp Res. 1999. PMID: 10069568
-
Ethanol sensitivity of NMDA receptors.Neurochem Int. 2002 Dec;41(6):377-82. doi: 10.1016/s0197-0186(02)00046-3. Neurochem Int. 2002. PMID: 12213224 Review.
-
Ethanol-induced inhibition of NMDA receptor channels.Neurochem Int. 1999 Aug;35(2):153-62. doi: 10.1016/s0197-0186(99)00057-1. Neurochem Int. 1999. PMID: 10405999 Review.
Cited by
-
Dephosphorylation of GluN2B C-terminal tyrosine residues does not contribute to acute ethanol inhibition of recombinant NMDA receptors.Alcohol. 2013 May;47(3):181-6. doi: 10.1016/j.alcohol.2012.12.015. Epub 2013 Jan 26. Alcohol. 2013. PMID: 23357553 Free PMC article.
-
Neurochemical Evidence of Preclinical and Clinical Reports on Target-Based Therapy in Alcohol Used Disorder.Neurochem Res. 2020 Feb;45(2):491-507. doi: 10.1007/s11064-019-02944-9. Epub 2020 Jan 2. Neurochem Res. 2020. PMID: 31898084 Review.
-
The neurobiology of alcohol consumption and alcoholism: an integrative history.Pharmacol Biochem Behav. 2013 Nov 15;113:20-37. doi: 10.1016/j.pbb.2013.10.009. Epub 2013 Oct 17. Pharmacol Biochem Behav. 2013. PMID: 24141171 Free PMC article. Review.
-
Effects of Repeated Ethanol Exposures on NMDA Receptor Expression and Locomotor Sensitization in Mice Expressing Ethanol Resistant NMDA Receptors.Front Neurosci. 2017 Feb 21;11:84. doi: 10.3389/fnins.2017.00084. eCollection 2017. Front Neurosci. 2017. PMID: 28270746 Free PMC article.
-
A novel alcohol-sensitive position in the N-methyl-D-aspartate receptor GluN2A subunit M3 domain regulates agonist affinity and ion channel gating.Mol Pharmacol. 2013 Oct;84(4):501-10. doi: 10.1124/mol.113.085993. Epub 2013 Jul 11. Mol Pharmacol. 2013. PMID: 23847085 Free PMC article.
References
-
- Anders DL, Blevins T, Smothers CT, Woodward JJ. Reduced ethanol inhibition of N-methyl-D-aspartate receptors by deletion of the NR1 C0 domain or overexpression of alpha-actinin-2 proteins. J Biol Chem. 2000;275:15019–15024. - PubMed
-
- Anders DL, Blevins T, Sutton G, Chandler LJ, Woodward JJ. Effects of c-Src tyrosine kinase on ethanol sensitivity of recombinant NMDA receptors expressed in HEK 293 cells. Alcohol Clin Exp Res. 1999a;23:357–362. - PubMed
-
- Anders DL, Blevins T, Sutton G, Swope S, Chandler LJ, Woodward JJ. Fyn tyrosine kinase reduces the ethanol inhibition of recombinant NR1/NR2A but not NR1/NR2B NMDA receptors expressed in HEK 293 cells. J Neurochem. 1999b;72:1389–1393. - PubMed
-
- Chatterton JE, Awobuluyi M, Premkumar LS, Takahashi H, Talantova M, Shin Y, Cui J, Tu S, Sevarino KA, Nakanishi N, et al. Excitatory glycine receptors containing the NR3 family of NMDA receptor subunits. Nature. 2002;415:793–798. - PubMed
-
- Cik M, Chazot PL, Stephenson FA. Expression of NMDAR1–1a (N598Q)/NMDAR2A receptors results in decreased cell mortality. Eur J Pharmacol. 1994;266:R1–R3. - PubMed
Publication types
MeSH terms
Substances
Grants and funding
LinkOut - more resources
Full Text Sources
Molecular Biology Databases
