. 2011 Jun;64(6):583-93.
doi: 10.1016/j.jclinepi.2010.09.007. Epub 2010 Dec 16.

Optimism bias leads to inconclusive results-an empirical study

Affiliations

Optimism bias leads to inconclusive results-an empirical study

Benjamin Djulbegovic et al. J Clin Epidemiol. 2011 Jun.

Abstract

Objective: Optimism bias refers to unwarranted belief in the efficacy of new therapies. We assessed the impact of optimism bias on a proportion of trials that did not answer their research question successfully and explored whether poor accrual or optimism bias is responsible for inconclusive results.

Study design: Systematic review.

Setting: Retrospective analysis of a consecutive-series phase III randomized controlled trials (RCTs) performed under the aegis of National Cancer Institute Cooperative groups.

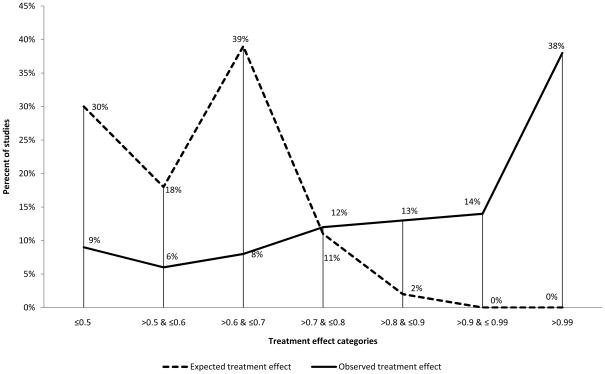
Results: Three hundred fifty-nine trials (374 comparisons) enrolling 150,232 patients were analyzed. Seventy percent (262 of 374) of the trials generated conclusive results according to the statistical criteria. Investigators made definitive statements related to the treatment preference in 73% (273 of 374) of studies. Investigators' judgments and statistical inferences were concordant in 75% (279 of 374) of trials. Investigators consistently overestimated their expected treatment effects but to a significantly larger extent for inconclusive trials. The median ratio of expected and observed hazard ratio or odds ratio was 1.34 (range: 0.19-15.40) in conclusive trials compared with 1.86 (range: 1.09-12.00) in inconclusive studies (P<0.0001). Only 17% of the trials had treatment effects that matched original researchers' expectations.

Conclusion: Formal statistical inference is sufficient to answer the research question in 75% of RCTs. The answers to the other 25% depend mostly on subjective judgments, which at times are in conflict with statistical inference. Optimism bias significantly contributes to inconclusive results.


Conflict of interest statement

Conflict of interest: None.

Figures

Figure 1
Figure 1
Classifying results from RCTs as true negative, positive or inconclusive. (Adapted from Alderson, P. BMJ 2004; 328: 476–477)
Figure 2
Figure 2
Flow chart describing the selection of studies. The figure also shows the results according to statistical criteria and treatment success according to investigators’ judgments.
Figure 3
Figure 3
Treatment success according to statistical criteria and investigators’ judgments (concordance versus non-concordance) (see text for details). (S= standard treatment; E=experimental treatment)
Figure 4
Figure 4
a) 4b). A ratio of actual/predicted patient accrual vs. observed/expected treatment effects. HR-hazard ratio, OR-observed ratio. Note that in Fig 4b) HR represents HR or OR. Results are shown as the ratio of the observed HR or OR divided by the expected HR or OR. All outcomes are normalized as “bad” (e.g. deaths instead of survival). Thus, a lower HR or OR indicates a larger treatment effect on a bad outcome. For example, an expected HR of 0.4 and an observed HR of 0.8 would correspond to a ratio of 2, meaning that the investigator expected the treatment effect to be twice as good as they actually observed (or, that investigators observed twice as smaller effect than they had planned for). A ratio of 1 means that the expected treatment effect was the same as the observed one, and a ratio below 1 would indicate that the investigators observed a larger effect than expected (the log transformation is used for better display).
Figure 4
Figure 4
a) 4b). A ratio of actual/predicted patient accrual vs. observed/expected treatment effects. HR-hazard ratio, OR-observed ratio. Note that in Fig 4b) HR represents HR or OR. Results are shown as the ratio of the observed HR or OR divided by the expected HR or OR. All outcomes are normalized as “bad” (e.g. deaths instead of survival). Thus, a lower HR or OR indicates a larger treatment effect on a bad outcome. For example, an expected HR of 0.4 and an observed HR of 0.8 would correspond to a ratio of 2, meaning that the investigator expected the treatment effect to be twice as good as they actually observed (or, that investigators observed twice as smaller effect than they had planned for). A ratio of 1 means that the expected treatment effect was the same as the observed one, and a ratio below 1 would indicate that the investigators observed a larger effect than expected (the log transformation is used for better display).
Figure 5
Figure 5
The distribution of treatment effects (expressed as hazard or odds ratio) and shown as the percentage difference between expected and observed results. The line at zero indicates that observed results perfectly matched expected treatment effects. The negative numbers indicate the extent (percentage) above which expectation exceeded the observed effects. The positive findings indicate the percentage above which actually observed results exceeded expectations.
Figure 6
Figure 6
The distribution of expected vs. observed results in relation to patient accrual. The line at zero indicates that observed results perfectly matched expected treatment effects. The negative numbers indicate the extent (percentage) above which expectation exceeded the observed effects. The positive findings indicate the percentage above which actually observed results exceeded expectations.
Figure 7
Figure 7
Distribution of categories of expected versus observed treatment effect across trials. As it can be seen, there is a tremendous discrepancy over the entire range of treatment effects between what investigators expected and what they actually observed.

References

    1. http://www.wma.net/e/policy/b3.htm. [cited; Available from:

    1. World Medical Association. World Medical Association Declaration of Helskinki. Ethical Principles for Medical Research Involving Human Subjects. 2007. [cited 2008 20th October]; Available from: http://www.wma.net/e/policy/b3.htm.
    1. Chalmers I. Well informed uncertainties about the effects of treatments. BMJ. 2004 February 28;328(7438):475–6. - PMC - PubMed
    1. Edwards SJL, Lilford RJ, Braunholtz DA, Jackson JC, Hewison J, Thornton J. Ethical issues in the design and conduct of randomized controlled trials. Health Technol Assessment. 1998;2(15):1–130. - PubMed
    1. Bradford Hill A. Medical ethics and controlled trials. BMJ. 1963;2:1043–49. - PMC - PubMed

Publication types

MeSH terms