

DNA methylation, isocitrate dehydrogenase mutation, and survival in glioma
- PMID: 21163902
- PMCID: PMC3022619
- DOI: 10.1093/jnci/djq497
DNA methylation, isocitrate dehydrogenase mutation, and survival in glioma
Abstract
Background: Although much is known about molecular and chromosomal characteristics that distinguish glioma histological subtypes, DNA methylation patterns of gliomas and their association with other tumor features such as mutation of isocitrate dehydrogenase (IDH) genes have only recently begun to be investigated.
Methods: DNA methylation of glioblastomas, astrocytomas, oligodendrogliomas, oligoastrocytomas, ependymomas, and pilocytic astrocytomas (n = 131) from the Brain Tumor Research Center at the University of California San Francisco, as well as nontumor brain tissues (n = 7), was assessed with the Illumina GoldenGate methylation array. Methylation data were subjected to recursively partitioned mixture modeling (RPMM) to derive methylation classes. Differential DNA methylation between tumor and nontumor was also assessed. The association between methylation class and IDH mutation (IDH1 and IDH2) was tested using univariate and multivariable analysis for tumors (n = 95) with available substrate for sequencing. Survival of glioma patients carrying mutant IDH (n = 57) was compared with patients carrying wild-type IDH (n = 38) using a multivariable Cox proportional hazards model and Kaplan-Meier analysis. All statistical tests were two-sided.
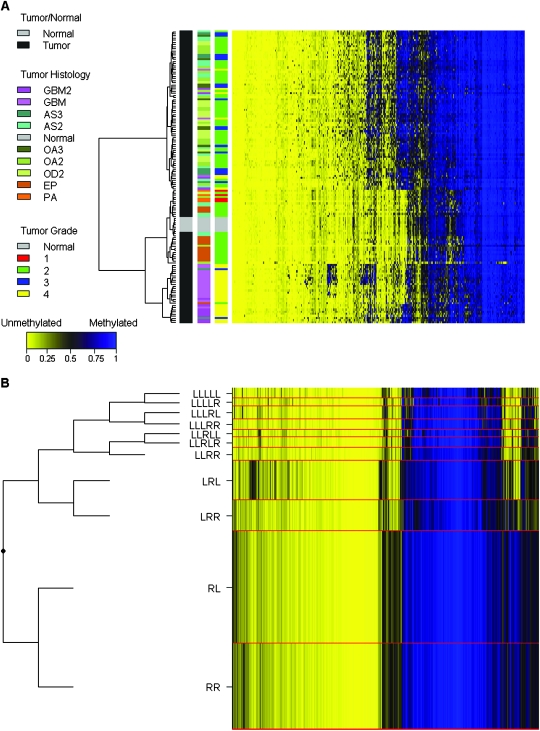
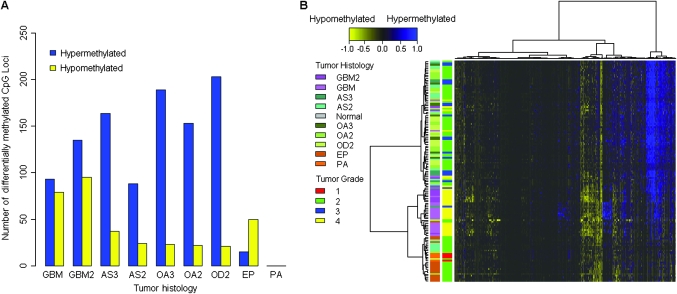
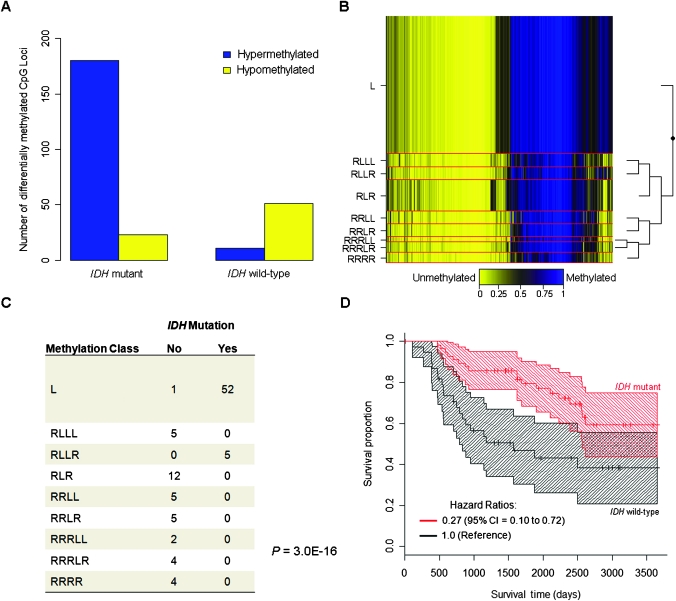
Results: We observed a statistically significant association between RPMM methylation class and glioma histological subtype (P < 2.2 × 10(-16)). Compared with nontumor brain tissues, across glioma tumor histological subtypes, the differential methylation ratios of CpG loci were statistically significantly different (permutation P < .0001). Methylation class was strongly associated with IDH mutation in gliomas (P = 3.0 × 10(-16)). Compared with glioma patients whose tumors harbored wild-type IDH, patients whose tumors harbored mutant IDH showed statistically significantly improved survival (hazard ratio of death = 0.27, 95% confidence interval = 0.10 to 0.72).
Conclusion: The homogeneity of methylation classes for gliomas with IDH mutation, despite their histological diversity, suggests that IDH mutation is associated with a distinct DNA methylation phenotype and an altered metabolic profile in glioma.
Figures
References
-
- Kleihues P, Burger PC, Scheithauer BW. The new WHO classification of brain tumours. Brain Pathol. 1993;3(3):255–268. - PubMed
-
- Stupp R, Mason WP, van den Bent MJ, et al. Radiotherapy plus concomitant and adjuvant temozolomide for glioblastoma. N Engl J Med. 2005;352(10):987–996. - PubMed
-
- Balss J, Meyer J, Mueller W, Korshunov A, Hartmann C, von Deimling A. Analysis of the IDH1 codon 132 mutation in brain tumors. Acta Neuropathol. 2008;116(6):597–602. - PubMed
Publication types
MeSH terms
Substances
Grants and funding
- R01CA126831/CA/NCI NIH HHS/United States
- R01 ES006717/ES/NIEHS NIH HHS/United States
- R01CA078609/CA/NCI NIH HHS/United States
- R01CA100679/CA/NCI NIH HHS/United States
- R01CA121147/CA/NCI NIH HHS/United States
- P50 CA097257/CA/NCI NIH HHS/United States
- R01ES06717/ES/NIEHS NIH HHS/United States
- R01 CA126939/CA/NCI NIH HHS/United States
- P30CA077598/CA/NCI NIH HHS/United States
- R01 CA052689/CA/NCI NIH HHS/United States
- R01 CA126831/CA/NCI NIH HHS/United States
- R01 CA078609/CA/NCI NIH HHS/United States
- R01 CA121147/CA/NCI NIH HHS/United States
- P50CA097257/CA/NCI NIH HHS/United States
- R01CA126939/CA/NCI NIH HHS/United States
- R01 CA100679/CA/NCI NIH HHS/United States
- R01CA52689/CA/NCI NIH HHS/United States
LinkOut - more resources
Full Text Sources
Other Literature Sources
Medical
Molecular Biology Databases
Research Materials
Miscellaneous
