

Allelic variation in TAS2R bitter receptor genes associates with variation in sensations from and ingestive behaviors toward common bitter beverages in adults
- PMID: 21163912
- PMCID: PMC3038275
- DOI: 10.1093/chemse/bjq132
Allelic variation in TAS2R bitter receptor genes associates with variation in sensations from and ingestive behaviors toward common bitter beverages in adults
Abstract
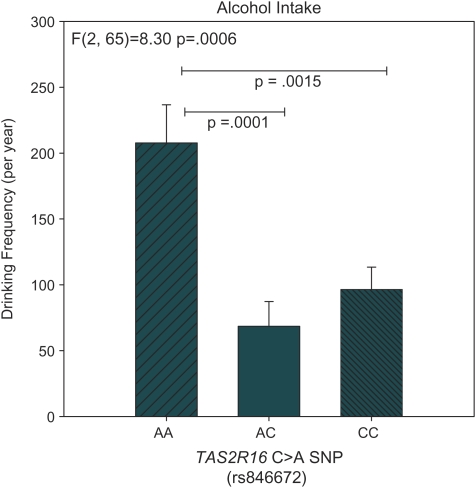
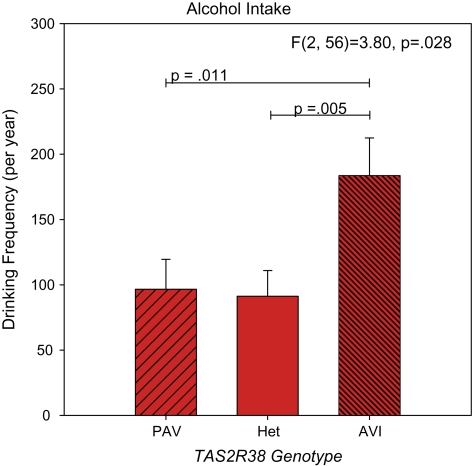
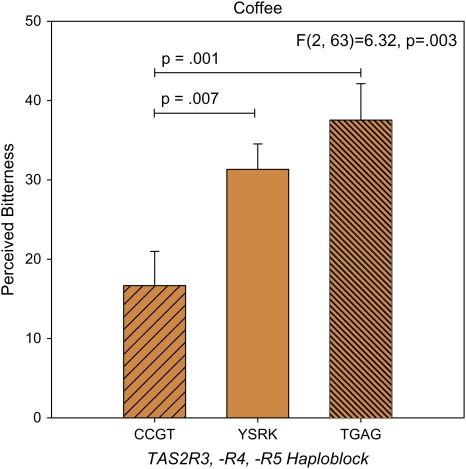
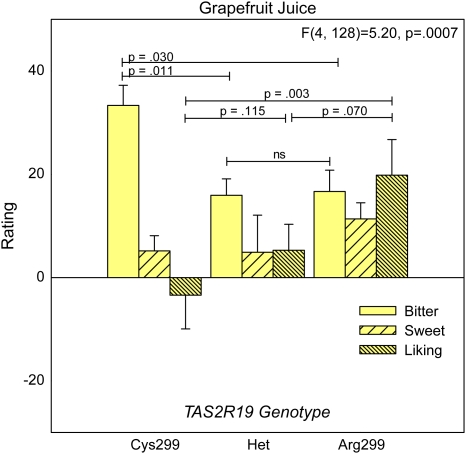
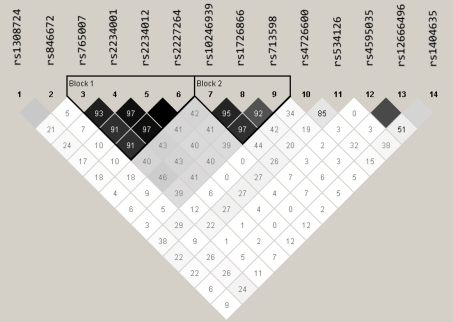
The 25 human bitter receptors and their respective genes (TAS2Rs) contain unusually high levels of allelic variation, which may influence response to bitter compounds in the food supply. Phenotypes based on the perceived bitterness of single bitter compounds were first linked to food preference over 50 years ago. The most studied phenotype is propylthiouracil bitterness, which is mediated primarily by the TAS2R38 gene and possibly others. In a laboratory-based study, we tested for associations between TAS2R variants and sensations, liking, or intake of bitter beverages among healthy adults who were primarily of European ancestry. A haploblock across TAS2R3, TAS2R4, and TAS2R5 explained some variability in the bitterness of espresso coffee. For grapefruit juice, variation at a TAS2R19 single nucleotide polymorphism (SNP) was associated with increased bitterness and decreased liking. An association between a TAS2R16 SNP and alcohol intake was identified, and the putative TAS2R38-alcohol relationship was confirmed, although these polymorphisms did not explain sensory or hedonic responses to sampled scotch whisky. In summary, TAS2R polymorphisms appear to influence the sensations, liking, or intake of common and nutritionally significant beverages. Studying perceptual and behavioral differences in vivo using real foods and beverages may potentially identify polymorphisms related to dietary behavior even in the absence of known ligands.
Figures
Similar articles
-
Sweet and bitter tastes of alcoholic beverages mediate alcohol intake in of-age undergraduates.Physiol Behav. 2005 Jan 17;83(5):821-31. doi: 10.1016/j.physbeh.2004.10.004. Epub 2004 Nov 21. Physiol Behav. 2005. PMID: 15639168 Clinical Trial.
-
Quinine Bitterness and Grapefruit Liking Associate with Allelic Variants in TAS2R31.Chem Senses. 2015 Jul;40(6):437-43. doi: 10.1093/chemse/bjv027. Epub 2015 May 29. Chem Senses. 2015. PMID: 26024668 Free PMC article.
-
Polymorphisms in TRPV1 and TAS2Rs associate with sensations from sampled ethanol.Alcohol Clin Exp Res. 2014 Oct;38(10):2550-60. doi: 10.1111/acer.12527. Epub 2014 Sep 25. Alcohol Clin Exp Res. 2014. PMID: 25257701 Free PMC article.
-
Bitter taste genetics--the relationship to tasting, liking, consumption and health.Food Funct. 2014 Dec;5(12):3040-54. doi: 10.1039/c4fo00539b. Food Funct. 2014. PMID: 25286017 Review.
-
The roles of genes in the bitter taste.AIMS Genet. 2019 Dec 24;6(4):88-97. doi: 10.3934/genet.2019.4.88. eCollection 2019. AIMS Genet. 2019. PMID: 31922012 Free PMC article. Review.
Cited by
-
Impact of sweet, umami, and bitter taste receptor (TAS1R and TAS2R) genomic and expression alterations in solid tumors on survival.Sci Rep. 2022 May 27;12(1):8937. doi: 10.1038/s41598-022-12788-z. Sci Rep. 2022. PMID: 35624283 Free PMC article.
-
Identification of an Amygdala-Thalamic Circuit That Acts as a Central Gain Mechanism in Taste Perceptions.J Neurosci. 2020 Jun 24;40(26):5051-5062. doi: 10.1523/JNEUROSCI.2618-19.2020. Epub 2020 May 5. J Neurosci. 2020. PMID: 32371606 Free PMC article.
-
Why We Must Continue to Investigate Menthol's Role in the African American Smoking Paradox.Nicotine Tob Res. 2016 Apr;18 Suppl 1(Suppl 1):S91-101. doi: 10.1093/ntr/ntv209. Nicotine Tob Res. 2016. PMID: 26980870 Free PMC article. Review.
-
Responsiveness to 6-n-propylthiouracil (PROP) is associated with salivary levels of two specific basic proline-rich proteins in humans.PLoS One. 2012;7(2):e30962. doi: 10.1371/journal.pone.0030962. Epub 2012 Feb 1. PLoS One. 2012. PMID: 22312435 Free PMC article. Clinical Trial.
-
Taste Receptor Polymorphisms and Immune Response: A Review of Receptor Genotypic-Phenotypic Variations and Their Relevance to Chronic Rhinosinusitis.Front Cell Infect Microbiol. 2018 Mar 7;8:64. doi: 10.3389/fcimb.2018.00064. eCollection 2018. Front Cell Infect Microbiol. 2018. PMID: 29564227 Free PMC article. Review.
References
-
- Alarcon S, Tharp A, Tharp C, Breslin PA. The effect of polymorphisms in 4 hTAS2R genes on PROP bitterness perception. Chem Senses. 2008;33:S43.
-
- Alsene K, Deckert J, Sand P, de Wit H. Association between A2a receptor gene polymorphisms and caffeine-induced anxiety. Neuropsychopharmacology. 2003;28:1694–1702. - PubMed
-
- Bartoshuk LM, Fast K, Snyder DJ. Differences in our sensory worlds: invalid comparisons with labeled scales. Curr Dir Psychol Sci. 2005;14:122–125.
-
- Bender R, Lange S. Adjusting for multiple testing—when and how? J Clin Epidemiol. 2001;54:343–349. - PubMed
Publication types
MeSH terms
Substances
Grants and funding
LinkOut - more resources
Full Text Sources
Other Literature Sources
