. 2011 Mar 3;117(9):2618-24.
doi: 10.1182/blood-2010-05-287102. Epub 2010 Dec 16.

In vitro assays misrepresent in vivo lineage potentials of murine lymphoid progenitors

Affiliations

In vitro assays misrepresent in vivo lineage potentials of murine lymphoid progenitors

Lauren I Richie Ehrlich et al. Blood. .

Abstract

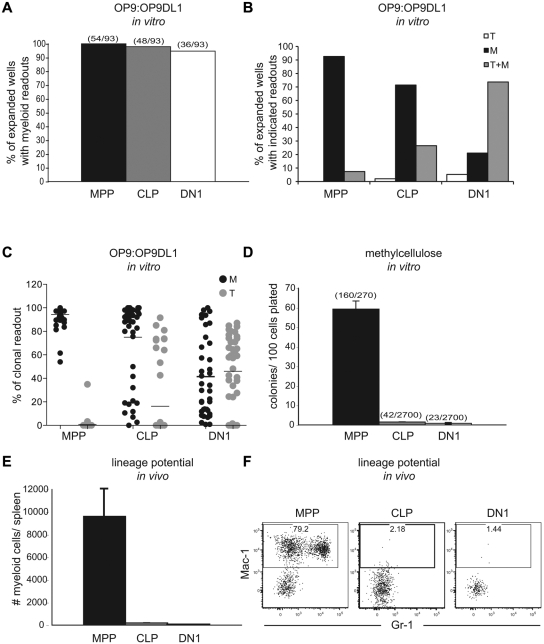
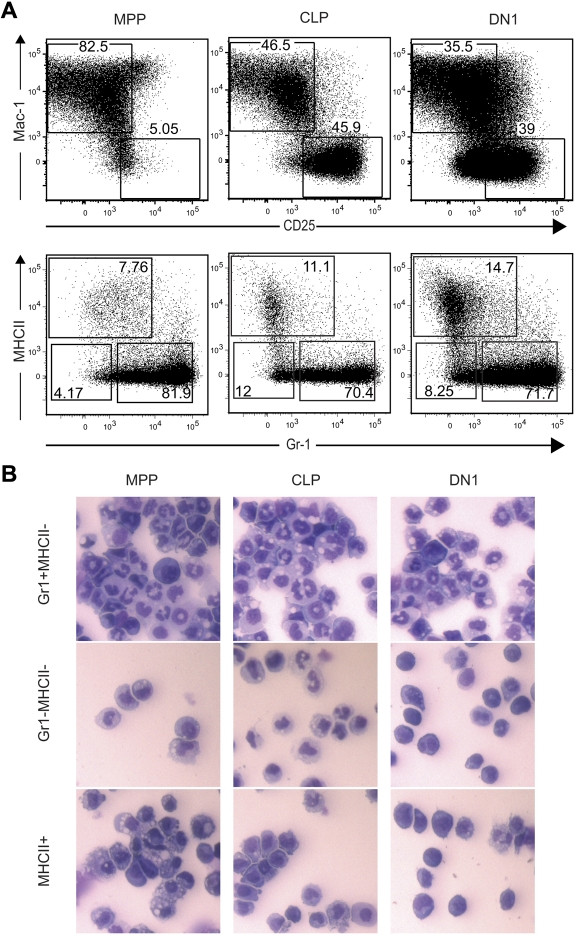
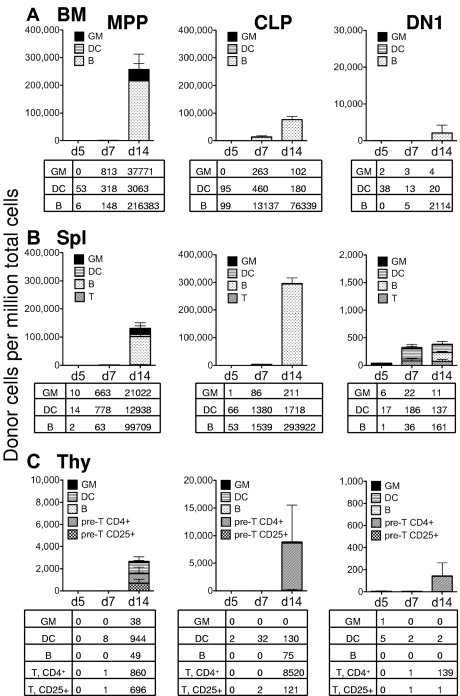
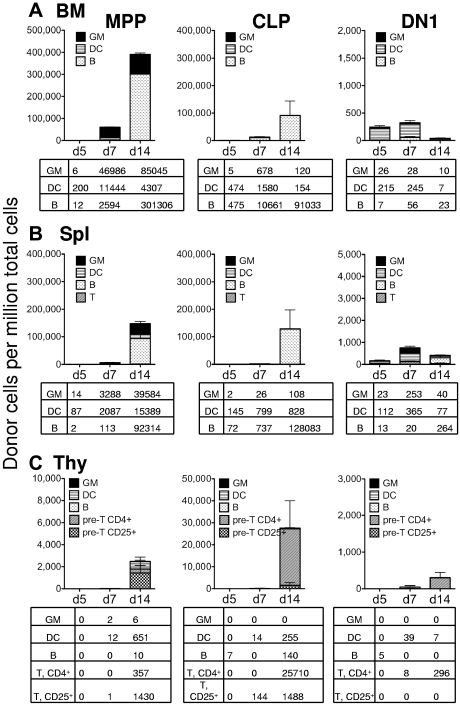
The identity of T-cell progenitors that seed the thymus has remained controversial, largely because many studies differ over whether these progenitors retain myeloid potential. Contradictory reports diverge in their use of various in vitro and in vivo assays. To consolidate these discordant findings, we compared the myeloid potential of 2 putative thymus seeding populations, common lymphoid progenitors (CLPs) and multipotent progenitors (MPPs), and the earliest intrathymic progenitor (DN1), using 2 in vitro assays and in vivo readouts. These assays gave contradictory results: CLP and DN1 displayed surprisingly robust myeloid potential on OP9-DL1 in vitro stromal cocultures but displayed little myeloid potential in vivo, as well as in methylcellulose cultures. MPP, on the other hand, displayed robust myeloid potential in all settings. We conclude that stromal cocultures reveal cryptic, but nonphysiologic, myeloid potentials of lymphoid progenitors, providing an explanation for contradictory findings in the field and underscoring the importance of using in vivo assays for the determination of physiologic lineage potentials.


Figures

Figure 1
Figure 1
The substantial in vitro myeloid potential of DN1 cells is not reproduced in either methylcellulose assays or in vivo. (A) MPP, CLP, or DN1 cells were clone- sorted into 96-well plates containing a confluent layer of a 1:1 mixture of OP9:OP9DL1 stroma in the presence of Flt3L, SCF, IL-3, IL-6, M-CSF, GM-CSF, G-CSF, and IL-7. After 11 days, wells were analyzed by flow cytometry for lineage markers, and those with cells of the phenotype CD45.2+ CD25 Mac-1+ were scored as myeloid cells. Graphs show the percentage of expanded colonies that contained at least 1% myeloid cells within the hematopoietic readout. Parentheses above columns indicate the number of wells with myeloid readout out of the total number of wells plated (regardless of whether the sorted cells expanded). The clonal readouts were composed almost entirely of either T lineage cells or myeloid lineages. Dendritic cells, as defined by CD11c+ Gr1, made up a minor component of the myeloid readout (Figure 2). Results are representative of 2 independent experiments. (B) Expanded wells from the assay in panel A were scored for colonies that contained T cells only, myeloid cells only, or T cells and myeloid cells. T cells were defined as CD45.2+ CD25+, and myeloid cells were defined as in panel A. The colonies had to contain at least 1% myeloid or T readouts to be scored for the respective lineage. (C) The percentage of myeloid or T cells, as defined earlier in the Figure 1 legend, in all wells with clonal expansion from the assay in panel A. (D) A total of 135 MPP, 1350 CLP, and 1350 DN1 cells were FACS-sorted into methylcellulose containing Flt3L, SCF, IL-3, IL-6, M-CSF, GM-CSF, and G-CSF in 2 separate experiments. After 6 days, colonies were counted, and the number of colonies per 100 cells plated was scored. Parentheses above columns indicate the total number of colonies per number of cells plated in the summation of the 2 experiments. Error bars represent the SD between plates. (E) A total of 5000 MPP, CLP, or DN1 cells were sorted from CD45.1 congenic donors and injected intravenously into sublethally irradiated recipients. After 7 days, splenic chimerism and lineages were assessed by flow cytometry. The graph shows the absolute number of donor-derived myeloid cells (CD45.1+Mac-1+CD11c) per spleen. Error bars represent the SD between mice. (F) Representative flow cytometric plots of donor splenocytes, showing myeloid readout quantified in panel E. Plots are pregated for CD45.1+ (donor) and CD11c cells.
Figure 2
Figure 2
The OP9:OP9DL1 culture system supports development of multiple myeloid lineages from MPP, CLP, and DN1. (A) A total of 100 MPP, CLP, or DN1 cells were sorted into 24-well plates containing a confluent layer of a 1:1 mixture of OP9:OP9DL1 stroma in the presence of Flt3L, SCF, IL-3, IL-6, M-CSF, GM-CSF, G-CSF, and IL-7. After 11 days, wells were analyzed by flow cytometry. Upper plots are gated on donor-derived cells and show gates for Mac-1+CD25 myeloid cells and CD25+Mac-1 T cells; lower plots are gated on the donor-derived, Mac-1+CD25 cells from the upper plots, revealing 3 subpopulations of myeloid cells generated from all 3 sorted progenitors. (B) The Gr-1+MHCII, Gr-1MHCII, and MHCII+ myeloid subsets shown in panel A were sorted, plated onto slides using a cytospin, and analyzed morphologically by Hemacolor stains.
Figure 3
Figure 3
In sublethally irradiated recipients, only MPPs display robust myeloid potential. Sublethally irradiated recipient C57BL/6 mice were transplanted with 5000 MPP (left column), 5000 CLP (middle column), or 5000 DN1 cells (right column) from GFP-transgenic mice. After 5, 7, or 14 days, the bone marrow (A), spleen (B), and thymus (C) of each mouse was analyzed for GFP+ donor cells by flow cytometry. Each column represents the level of GFP+ chimerism in that tissue, and the different patterns indicate the chimerism of the different lineages. The lineages were determined as follows: Myeloid cells (GM) were defined as Mac-1+Gr-1+CD11c; dendritic cells (DC) were defined as CD11c+; B cells were defined as CD19+. T lineage cells were defined as either CD4+ (pre-T, CD4+) or CD25+ (pre-T, CD25+) in the thymus. At day 14, most thymocytes were immature, and antibodies to CD4 and CD25 labeled nearly all T lineage cells. The tables below each graph show the frequency (cells/million live cells) of each donor cell lineage for each tissue analyzed and represent the average from 3 transplanted mice. This experiment was performed twice, with similar results.
Figure 4
Figure 4
In lethally irradiated recipients, only MPP display robust myeloid potential. Lethally irradiated recipient mice were transplanted with 5000 MPP (left column), 5000 CLP (middle column), or 5000 DN1 (right column) from GFP-transgenic mice. Recipient mice were also transplanted with 300 000 “helper” bone marrow cells, so that they would recover from the irradiation. Other than the irradiation dosage and the use of “helper” bone marrow, the description of this figure is identical to the description of Figure 3. (A) Bone marrow cells. (B) Splenocytes. (C) Thymocytes.

Comment in

References

    1. Mansson R, Hultquist A, Luc S, et al. Molecular evidence for hierarchical transcriptional lineage priming in fetal and adult stem cells and multipotent progenitors. Immunity. 2007;26(4):407–419. - PubMed
    1. Iwasaki-Arai J, Iwasaki H, Miyamoto T, Watanabe S, Akashi K. Enforced granulocyte/macrophage colony-stimulating factor signals do not support lymphopoiesis, but instruct lymphoid to myelomonocytic lineage conversion. J Exp Med. 2003;197(10):1311–1322. - PMC - PubMed
    1. Kondo M, Scherer DC, Miyamoto T, et al. Cell-fate conversion of lymphoid-committed progenitors by instructive actions of cytokines. Nature. 2000;407(6802):383–386. - PubMed
    1. King A, Kondo M, Scherer D, Weissman I. Lineage infidelity in myeloid cells with TCR gene rearrangement: a latent developmental potential of proT cells revealed by ectopic cytokine receptor signaling. Proc Natl Acad Sci U S A. 2002;99(7):4508–4513. - PMC - PubMed
    1. Hsu C-L, King-Fleischman AG, Lai AY, Matsumoto Y, Weissman IL, Kondo M. Antagonistic effect of CCAAT enhancer-binding protein-alpha and Pax5 in myeloid or lymphoid lineage choice in common lymphoid progenitors. Proc Natl Acad Sci U S A. 2006;103(3):672–677. - PMC - PubMed

Publication types

MeSH terms

Substances