

Kidney Dendritic Cells Become Pathogenic during Crescentic Glomerulonephritis with Proteinuria
- PMID: 21164025
- PMCID: PMC3029903
- DOI: 10.1681/ASN.2010050548
Kidney Dendritic Cells Become Pathogenic during Crescentic Glomerulonephritis with Proteinuria
Abstract
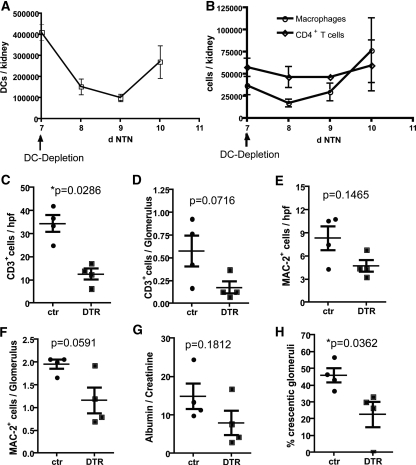
It is unclear why kidney dendritic cells attenuate some models of kidney disease but aggravate others. Kidney dendritic cells ameliorate the early phase of nonaccelerated nephrotoxic nephritis, a murine model of crescentic glomerulonephritis, but their effect on the later phase is unknown. Here, we report that kidney dendritic cells at later stages of nephrotoxic nephritis expressed higher levels of costimulatory molecules but lower levels of the cosuppressor molecule ICOS-L and started production of IL-12/23p40 and TNF-α. Furthermore, we noted that kidney dendritic cells captured more filterable antigen in proteinuric mice at late time points of nephrotoxic nephritis and started to capture molecules that were too large for filtration by a healthy kidney. They presented filtered antigen to Th cells, which responded by producing the proinflammatory cytokines IL-2, IFN-γ, TNF-α, IL-6, and IL-17. Notably, production of the suppressive cytokine IL-10 further increased in late nephrotoxic nephritis. Depletion of kidney dendritic cells at a late stage attenuated nephrotoxic nephritis, in contrast to the exacerbation observed with depletion at an early stage, indicating that their acquired proinflammatory phenotype adversely affected disease. These findings indicate that the intrarenal inflammatory microenvironment determines how kidney dendritic cells affect nephritis. In addition, proteinuria may harm the kidney by providing dendritic cells with more antigens to stimulate potentially pathogenic Th cells.
Figures


Similar articles
-
Innate and adaptive immunity in experimental glomerulonephritis: a pathfinder tale.Pediatr Nephrol. 2017 Jun;32(6):943-947. doi: 10.1007/s00467-016-3404-7. Epub 2016 May 11. Pediatr Nephrol. 2017. PMID: 27169420 Free PMC article. Review.
-
Renal dendritic cells stimulate IL-10 production and attenuate nephrotoxic nephritis.J Am Soc Nephrol. 2008 Mar;19(3):527-37. doi: 10.1681/ASN.2007060684. Epub 2008 Jan 30. J Am Soc Nephrol. 2008. PMID: 18235094 Free PMC article.
-
Chemokines play a critical role in the cross-regulation of Th1 and Th17 immune responses in murine crescentic glomerulonephritis.Kidney Int. 2012 Jul;82(1):72-83. doi: 10.1038/ki.2012.101. Epub 2012 Apr 11. Kidney Int. 2012. PMID: 22495297
-
TH1 and TH17 cells promote crescent formation in experimental autoimmune glomerulonephritis.J Pathol. 2015 Sep;237(1):62-71. doi: 10.1002/path.4559. Epub 2015 Jun 11. J Pathol. 2015. PMID: 25965582
-
Mechanisms and functions of IL-17 signaling in renal autoimmune diseases.Mol Immunol. 2018 Dec;104:90-99. doi: 10.1016/j.molimm.2018.09.005. Epub 2018 Nov 15. Mol Immunol. 2018. PMID: 30448610 Review.
Cited by
-
Batf3-dependent dendritic cells in the renal lymph node induce tolerance against circulating antigens.J Am Soc Nephrol. 2013 Mar;24(4):543-9. doi: 10.1681/ASN.2012101022. Epub 2013 Feb 14. J Am Soc Nephrol. 2013. PMID: 23411785 Free PMC article.
-
Innate and adaptive immunity in experimental glomerulonephritis: a pathfinder tale.Pediatr Nephrol. 2017 Jun;32(6):943-947. doi: 10.1007/s00467-016-3404-7. Epub 2016 May 11. Pediatr Nephrol. 2017. PMID: 27169420 Free PMC article. Review.
-
The loss of renal dendritic cells and activation of host adaptive immunity are long-term effects of ischemia/reperfusion injury following syngeneic kidney transplantation.Kidney Int. 2012 May;81(10):1015-1025. doi: 10.1038/ki.2011.458. Epub 2012 Jan 25. Kidney Int. 2012. PMID: 22278023 Free PMC article.
-
TNF-α in T lymphocytes attenuates renal injury and fibrosis during nephrotoxic nephritis.Am J Physiol Renal Physiol. 2020 Jan 1;318(1):F107-F116. doi: 10.1152/ajprenal.00347.2019. Epub 2019 Nov 18. Am J Physiol Renal Physiol. 2020. PMID: 31736350 Free PMC article.
-
Interplay of Na+ Balance and Immunobiology of Dendritic Cells.Front Immunol. 2019 Mar 29;10:599. doi: 10.3389/fimmu.2019.00599. eCollection 2019. Front Immunol. 2019. PMID: 30984179 Free PMC article. Review.
References
-
- Kaissling B, Le Hir M: Characterization and distribution of interstitial cell types in the renal cortex of rats. Kidney Int 45: 709–720, 1994 - PubMed
-
- Kruger T, Benke D, Eitner F, Lang A, Wirtz M, Hamilton-Williams EE, Engel D, Giese B, Muller-Newen G, Floege J, Kurts C: Identification and functional characterization of dendritic cells in the healthy murine kidney and in experimental glomerulonephritis. J Am Soc Nephrol 15: 613–621, 2004 - PubMed
-
- Soos TJ, Sims TN, Barisoni L, Lin K, Littman DR, Dustin ML, Nelson PJ: CX3CR1+ interstitial dendritic cells form a contiguous network throughout the entire kidney. Kidney Int 70: 591–596, 2006 - PubMed
-
- Woltman AM, de Fijter JW, Zuidwijk K, Vlug AG, Bajema IM, van der Kooij SW, van Ham V, van Kooten C: Quantification of dendritic cell subsets in human renal tissue under normal and pathological conditions. Kidney Int 71: 1001–1008, 2007 - PubMed
-
- Steinman RM, Bonifaz L, Fujii S, Liu K, Bonnyay D, Yamazaki S, Pack M, Hawiger D, Iyoda T, Inaba K, Nussenzweig MC: The innate functions of dendritic cells in peripheral lymphoid tissues. Adv Exp Med Biol 560: 83–97, 2005 - PubMed
Publication types
MeSH terms
Substances
LinkOut - more resources
Full Text Sources
Research Materials
Miscellaneous
