
Aptamer-based multiplexed proteomic technology for biomarker discovery

Larry Gold et al. PLoS One. .

Abstract

Background: The interrogation of proteomes ("proteomics") in a highly multiplexed and efficient manner remains a coveted and challenging goal in biology and medicine.

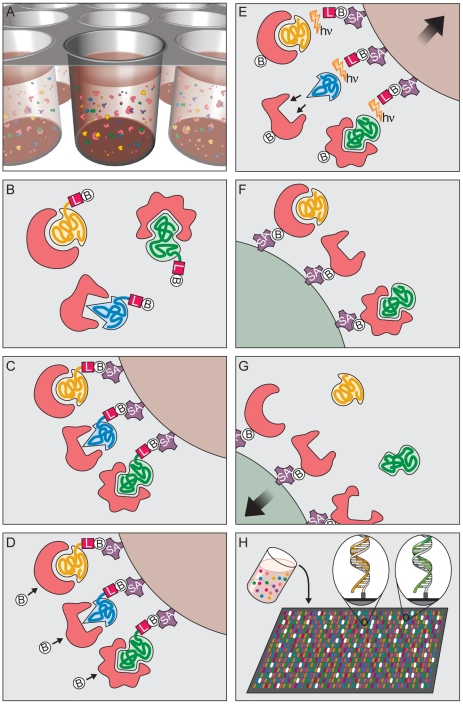
Methodology/principal findings: We present a new aptamer-based proteomic technology for biomarker discovery capable of simultaneously measuring thousands of proteins from small sample volumes (15 µL of serum or plasma). Our current assay measures 813 proteins with low limits of detection (1 pM median), 7 logs of overall dynamic range (~100 fM-1 µM), and 5% median coefficient of variation. This technology is enabled by a new generation of aptamers that contain chemically modified nucleotides, which greatly expand the physicochemical diversity of the large randomized nucleic acid libraries from which the aptamers are selected. Proteins in complex matrices such as plasma are measured with a process that transforms a signature of protein concentrations into a corresponding signature of DNA aptamer concentrations, which is quantified on a DNA microarray. Our assay takes advantage of the dual nature of aptamers as both folded protein-binding entities with defined shapes and unique nucleotide sequences recognizable by specific hybridization probes. To demonstrate the utility of our proteomics biomarker discovery technology, we applied it to a clinical study of chronic kidney disease (CKD). We identified two well known CKD biomarkers as well as an additional 58 potential CKD biomarkers. These results demonstrate the potential utility of our technology to rapidly discover unique protein signatures characteristic of various disease states.

Conclusions/significance: We describe a versatile and powerful tool that allows large-scale comparison of proteome profiles among discrete populations. This unbiased and highly multiplexed search engine will enable the discovery of novel biomarkers in a manner that is unencumbered by our incomplete knowledge of biology, thereby helping to advance the next generation of evidence-based medicine.


Conflict of interest statement

Competing Interests: The authors have read the journal's policy and have the following conflicts: L Gold, D Ayers, J Bertino, C Bock, E Brody, J Carter, T Fitzwater, D Flather, A Forbes, T Foreman, C Fowler, B Gawande, M Goss, M Gunn, S Gupta, D Halladay, N Janjic, T Jarvis, S Jennings, E Katilius, T Keeney, N Kim, S Kraemer, N Le, B Lollo, W Mayfield, M Mehan, R Mehler, S Nelson, M Nikrad, U Ochsner, R Ostroff, M Otis, S Pietrasiewicz, D Resnicow, J Rohloff, G Sanders, D Schneider, B Singer, A Stewart, J Vaught, M Vrkljan, J Walker, M Watrobka, S Waugh, A Weiss, S Wilcox, S Wolk, C Zhang, and D Zichi are employed by SomaLogic. B Eaton and T Koch are consultants to SomaLogic. A Bock, A Dalby, B Eaton, J Heil, J Heilig, B Hicke, G Husar, L Kroiss, W Lindsey, M Nelson, D Nieuwlandt, S Sattin, M Stanton, A Sterkel, S Stratford, and A Wolfson are former employees of SomaLogic. SomaLogic has filed patent applications on aspects of this work. This does not alter the authors' adherence to all the PLoS ONE policies on sharing data and materials.

Figures

Figure 1
Figure 1. Modified Nucleotides.
Nucleotide triphosphate analogs modified at the 5-position (R) of uridine (dUTP): 5-benzylaminocarbonyl-dU (BndU); 5-naphthylmethylaminocarbonyl-dU (NapdU): 5-tryptaminocarbonyl-dU (TrpdU); and 5-isobutylaminocarbonyl-dU (iBudU).
Figure 2
Figure 2. Dissociation constants.
Distribution of dissociation constant (Kd) values for 434 SOMAmers.
Figure 3
Figure 3. Kinetic discrimination between cognate and non-cognate interactions.
Dissociation rate measurements for specific and non-specific protein interactions with representative Kallistatin, LBP, and TIG2 SOMAmers. Histone H1.2 binds to random DNA sequences and was used to demonstrate non-specific binding. The fraction of radiolabeled SOMAmer (10 pM) bound to its cognate target is shown after addition of 50 nM unlabeled SOMAmer (squares) or 0.3 mM dextran sulfate (triangles) as a function of time. Rapid dissociation of non-specific complexes in the presence of 0.3 mM dextran sulfate is also shown (diamonds).
Figure 4
Figure 4. Dissociation rates.
Distribution of dissociation rate (t1/2) values for 72 SOMAmers representative of those in proteomic arrays.
Figure 5
Figure 5. Affinity capture assay.
SOMAmers are mixed with the target sample (purified protein or plasma) and incubated to bind to equilibrium. In Catch-1 bound SOMAmer(S)-protein(P) complexes are captured onto streptavidin beads (SA) and the proteins are tagged with biotin (B) (NHS- biotin) and fluorescent label (F) (NHS Alexa 647). Unbound proteins are washed away. Bound complexes are released from the beads by cleaving the photo-cleavable linker (PC) with ultraviolet light. In Catch-2 SOMAmer-protein complexes are captured onto monomeric avidin beads (A), washed, and eluted from the beads with 2 mM biotin. At this stage, SOMAmer-protein complexes are subjected to a kinetic challenge analogous to that used in the proteomics assay. Specific complexes survive the challenge and non-specific complexes dissociate. In the final step, Catch-3, bound complexes are captured onto primer beads (PB) by DNA primer that is complementary to a portion of the SOMAmer and any remaining unbound protein resulting from the kinetic challenge is washed away. Finally, the captured complexes are dissociated with 20 mM NaOH and the target protein is eluted for analysis by PAGE.
Figure 6
Figure 6. Affiinity capture of representative SOMAmer protein targets.
SDS-PAGE visualization of representative SOMAmer protein targets p Kallistatin, LBP and TIG2. The Kallistatin gel shows proteins bound to the Kallistatin SOMAmer for target added to buffer (lane 1), target added to 10% plasma (lane 2), and 10% plasma alone (lane 3). The first set of three lanes demonstrates all of the proteins eluted from Catch-1 beads. The second set of lanes shows the SOMAmer-bound proteins eluted from Catch-2 beads. The LBP and TIG2 gels demonstrate proteins recovered from 10% plasma using the LBP and TIG2 SOMAmers, respectively (without adding proteins to plasma for these three gels). The endogenous plasma proteins captured by the Kallistatin, LBP, and TIG2 SOMAmers were identified by LC-MS/MS as the intended target proteins (Table 2). The remaining gels show affinity capture assays for CKD-related proteins. For each example the gel shows the results for purified target protein spiked into buffer (lane 1), purified target protein spiked into 10% plasma (lane 2), and 10% plasma (lane 3). The first set of three lanes demonstrates all of the proteins eluted from Catch-1 beads. The second set of lanes shows the aptamer-bound proteins eluted from Catch-2 beads.
Figure 7
Figure 7. Principle of multiplex SOMAmer affinity assay.
(A) Binding. SOMAmers and samples are mixed in 96-well microwell plates and allowed to bind. Cognate and non-cognate SOMAmer-target protein complexes form. Free SOMAmer and protein are also present. (B–H) Schematic sequence of assay steps leading to quantitative readout of target proteins. (B) SOMAmer-protein binding: DNA-based SOMAmer molecules (gold, blue, and green) have unique shapes selected to bind to a specific protein. SOMAmers contain biotin (B), a photo-cleavable linker (L) and a fluorescent tag at the 5′ end. Most SOMAmers (gold and green) bind to cognate proteins (red), but some (blue) form non-cognate complexes. (C) Catch-1. SOMAmers are captured onto a bead coated with streptavidin (SA) which binds biotin. Un-complexed proteins are washed away. (D) Proteins are tagged with NHS-biotin. (E) Photocleavage and kinetic challenge. UV light (hν) cleaves the linker and SOMAmers are released from beads, leaving biotin on bead. Samples are challenged with anionic competitor (dextran sulfate). Non-cognate complexes (blue SOMAmer) preferentially dissociate. (F) Catch-2 SOMAmer-protein complexes are captured onto new avidin coated beads by protein biotin tag. Free SOMAmers are washed away. (G) SOMAmers are released from complexes into solution at high pH. (H) Remaining SOMAmers are quantified by hybridization to microarray containing single-stranded DNA probes complementary to SOMAmer DNA sequence, which form a double-stranded helix. Hybridized SOMAmers are detected by fluorescent tags when the array is scanned.
Figure 8
Figure 8. Proteomic assay standard curves.
Each plot shows the standard curve for eight replicates of target spiked into buffer (blue squares). Triplicate measurements from diluted normal serum (red triangles, measured dilution indicated) are plotted onto the standard curve, and the calculated normal concentrations in 100% serum are shown.
Figure 9
Figure 9. Target isoelectric points.
Distribution of isoelectric points (pI) of proteins for which SOMAmers have been selected (bars) and of all human protein chains in UniProt (dashed line).
Figure 10
Figure 10. Protein target menu gene ontology.
Distribution of most common gene ontology terms associated with the proteins measured by the current array.
Figure 11
Figure 11. Biomarker discovery in CKD.
Distribution of the false discovery rate (q-value) for the Mann-Whitney test statistic comparing late-stage vs. early-stage CKD for each protein measured (indicated as a bar on the x-axis) ordered arbitrarily.
Figure 12
Figure 12. Potential CKD biomarkers.
Eleven analytes with the smallest q-values (<3.5×10⁻⁷). Protein concentrations (expressed as RFU values) as a function of renal clearance for the eleven best biomarkers of late-stage (red circles) vs. early-stage CKD (blue circles).
Figure 13
Figure 13. Comparison of a protein's molecular mass and the probability that it is a CKD biomarker (q-value (p-value corrected for false discovery rate)).

References

    1. Zichi D, Eaton B, Singer B, Gold L. Proteomics and diagnostics: Let's Get Specific, again. Curr Opin Chem Biol. 2008;12:78–85. - PubMed
    1. Pan S, Aebersold R, Chen R, Rush J, Goodlett DR, et al. Mass spectrometry based targeted protein quantification: methods and applications. J Proteome Res. 2009;8:787–797. - PMC - PubMed
    1. Service RF. Proteomics. Proteomics ponders prime time. Science. 2008;321:1758–1761. - PubMed
    1. Liotta L, Petricoin F. Mass Spectrometry-Based Protein Biomarker Discovery and Measurement: Sensitivity is the Greatest Hurdle. Clinical Proteomics. 2010;6:4–5.
    1. Silberring J, Ciborowski P. Biomarker discovery and clinical proteomics. Trends Analyt Chem. 2010;29:128. - PMC - PubMed

Publication types