

The use of combined single photon emission computed tomography and X-ray computed tomography to assess the fate of inhaled aerosol
- PMID: 21166585
- PMCID: PMC3117300
- DOI: 10.1089/jamp.2010.0843
The use of combined single photon emission computed tomography and X-ray computed tomography to assess the fate of inhaled aerosol
Abstract
Background: Gamma camera imaging is widely used to assess pulmonary aerosol deposition. Conventional planar imaging provides limited information on its regional distribution. In this study, single photon emission computed tomography (SPECT) was used to describe deposition in three dimensions (3D) and combined with X-ray computed tomography (CT) to relate this to lung anatomy. Its performance was compared to planar imaging.
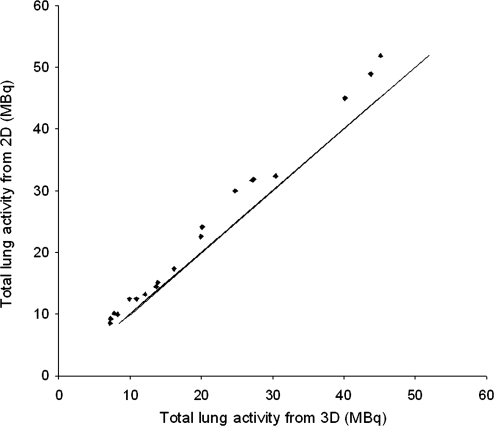
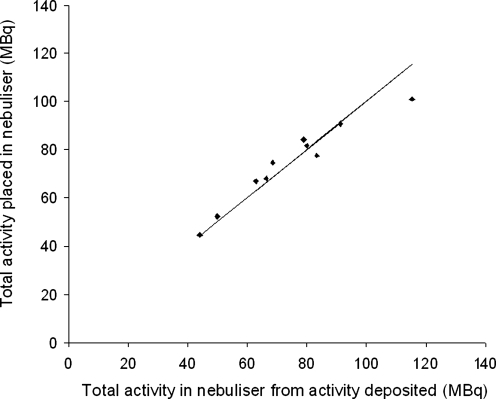
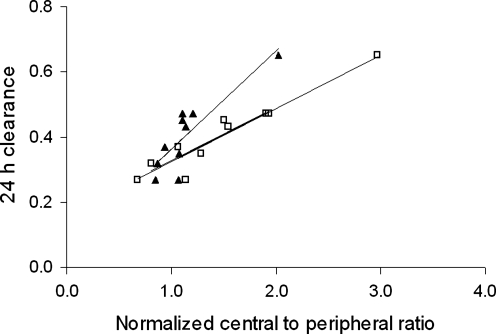
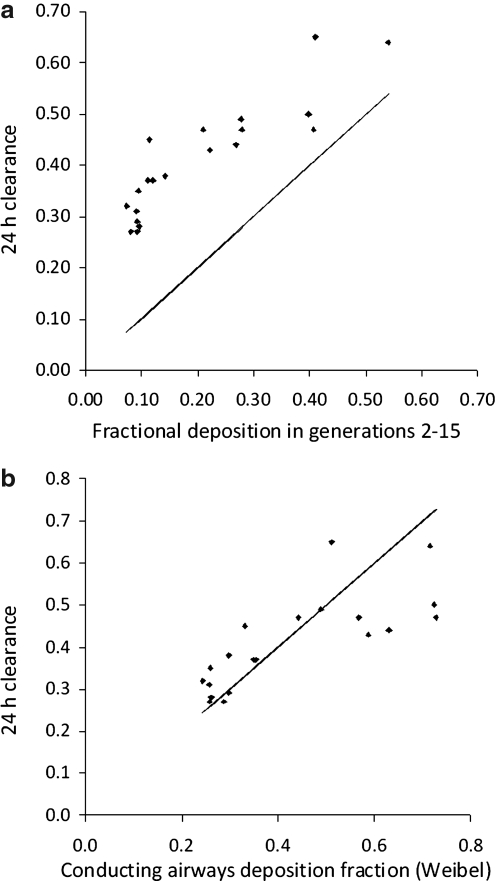
Methods: Ten SPECT/CT studies were performed on five healthy subjects following carefully controlled inhalation of radioaerosol from a nebulizer, using a variety of inhalation regimes. The 3D spatial distribution was assessed using a central-to-peripheral ratio (C/P) normalized to lung volume and for the right lung was compared to planar C/P analysis. The deposition by airway generation was calculated for each lung and the conducting airways deposition fraction compared to 24-h clearance.
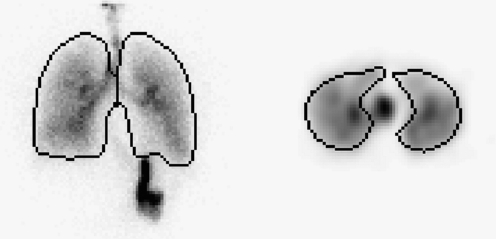
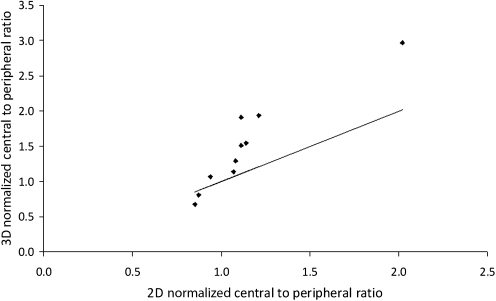
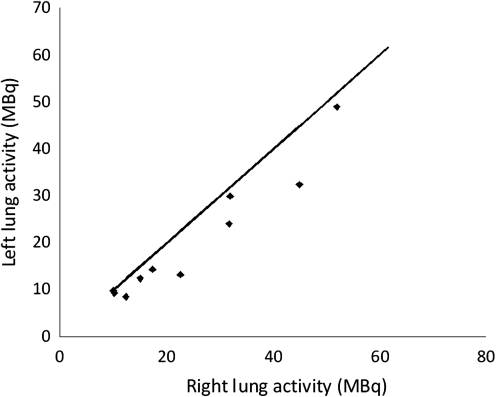
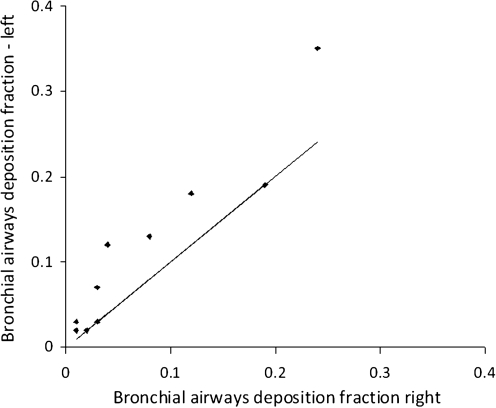
Results: The 3D normalized C/P ratio correlated more closely with 24-h clearance than the 2D ratio for the right lung [coefficient of variation (COV), 9% compared to 15% p < 0.05]. Analysis of regional distribution was possible for both lungs in 3D but not in 2D due to overlap of the stomach on the left lung. The mean conducting airways deposition fraction from SPECT for both lungs was not significantly different from 24-h clearance (COV 18%). Both spatial and generational measures of central deposition were significantly higher for the left than for the right lung.
Conclusions: Combined SPECT/CT enabled improved analysis of aerosol deposition from gamma camera imaging compared to planar imaging. 3D radionuclide imaging combined with anatomical information from CT and computer analysis is a useful approach for applications requiring regional information on deposition.
Figures

References
-
- Newman SP. Pitcairn G. Hirst PH. A brief history of gamma scintigraphy. J Aerosol Med. 2001;14:139–145. - PubMed
-
- Fleming JS. Conway JH. Three-dimensional imaging of aerosol distribution. J Aerosol Med. 2001;14:147–153. - PubMed
-
- Perring S. Summers Q. Fleming JS. Nassim MA. Holgate ST. A new method of quantification of the pulmonary regional distribution of aerosols using combined CT and SPECT and its application to nedocromil sodium administered by metered dose inhaler. Br J Radiol. 1994;67:46–53. - PubMed
-
- Fleming JS. Halson P. Conway JH. Moore E. Nassim MA. Hashish AH. Bailey AG. Holgate ST. Martonen TB. Three dimensional description of pulmonary deposition of inhaled aerosol using data from multimodality imaging. J Nucl Med. 1996;37:873–877. - PubMed
-
- Bocher M. Balan A. Krausz Y. Shrem Y. Lonn A. Wilk M. Chisin R. Gamma camera-mounted anatomical X-ray tomography: technology, system characteristics and first images. Eur J Nucl Med. 2000;27:619–627. - PubMed
Publication types
MeSH terms
Substances
LinkOut - more resources
Full Text Sources
Other Literature Sources
Medical
Miscellaneous
