Protected-area boundaries as filters of plant invasions
- PMID: 21166715
- PMCID: PMC3085078
- DOI: 10.1111/j.1523-1739.2010.01617.x
Protected-area boundaries as filters of plant invasions
Abstract
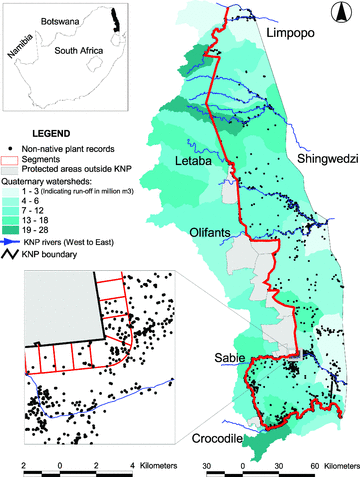
Human land uses surrounding protected areas provide propagules for colonization of these areas by non-native species, and corridors between protected-area networks and drainage systems of rivers provide pathways for long-distance dispersal of non-native species. Nevertheless, the influence of protected-area boundaries on colonization of protected areas by invasive non-native species is unknown. We drew on a spatially explicit data set of more than 27,000 non-native plant presence records for South Africa's Kruger National Park to examine the role of boundaries in preventing colonization of protected areas by non-native species. The number of records of non-native invasive plants declined rapidly beyond 1500 m inside the park; thus, we believe that the park boundary limited the spread of non-native plants. The number of non-native invasive plants inside the park was a function of the amount of water runoff, density of major roads, and the presence of natural vegetation outside the park. Of the types of human-induced disturbance, only the density of major roads outside the protected area significantly increased the number of non-native plant records. Our findings suggest that the probability of incursion of invasive plants into protected areas can be quantified reliably.
©2010 Society for Conservation Biology.
Figures


References
-
- Alston KP, Richardson DM. The roles of habitat features, disturbance, and distance from putative source populations in structuring alien plant invasions at the urban/wildland interface on the Cape Peninsula, South Africa. Biological Conservation. 2006;132:83–198.
-
- Bourg NA, McShea WJ, Gill DE. Putting a CART before the search: successful habitat prediction for a rare forest herb. Ecology. 2005;86:2793–2804.
-
- Breiman L, Friedman JH, Olshen RA, Stone CG. Classification and regression trees. Belmont, California: Wadsworth International Group; 1984.
-
- Chambers JM, Cleveland WS, Kleiner B, Tukey PA. Belmont, California: Wadsworth International Group; 1983. Graphical methods for data analysis.
-
- Cleveland WS. Robust locally weighted regression and smoothing scatterplots. Journal of American Statistical Association. 1979;74:829–836.
Publication types
MeSH terms
LinkOut - more resources
Full Text Sources

