. 2011 Sep;15(9):1896-913.
doi: 10.1111/j.1582-4934.2010.01180.x.

In vitro and in vivo properties of distinct populations of amniotic fluid mesenchymal progenitor cells

Affiliations

In vitro and in vivo properties of distinct populations of amniotic fluid mesenchymal progenitor cells

Maria G Roubelakis et al. J Cell Mol Med. 2011 Sep.

Abstract

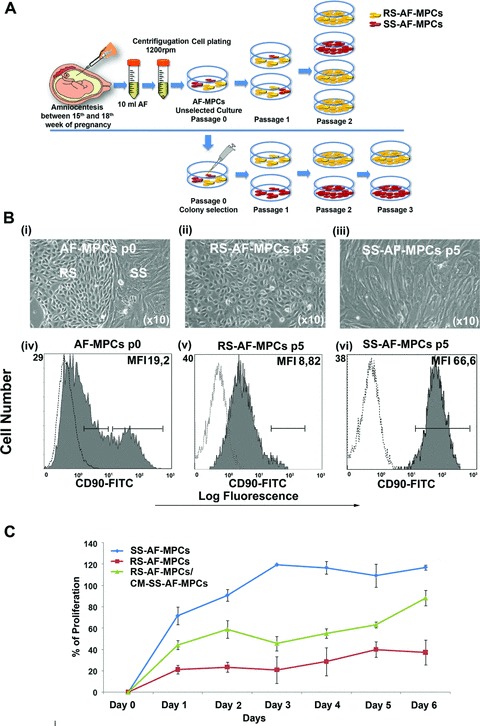
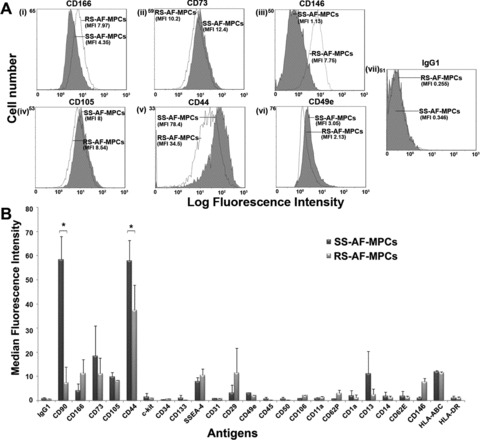
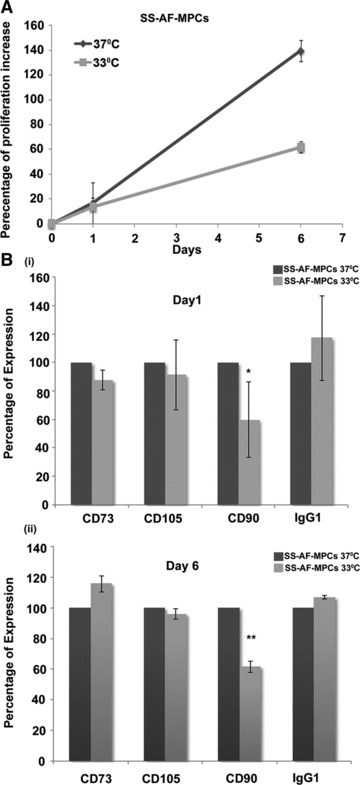
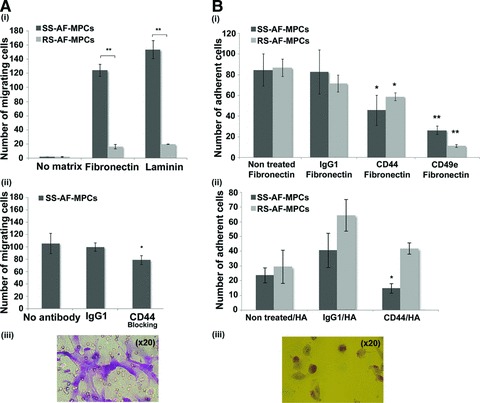
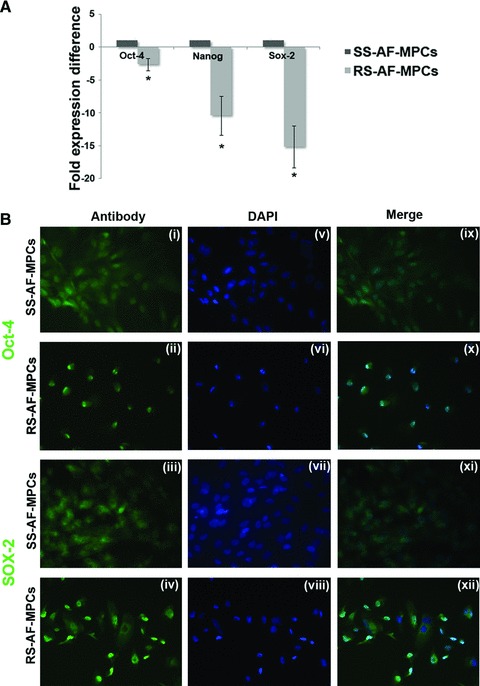
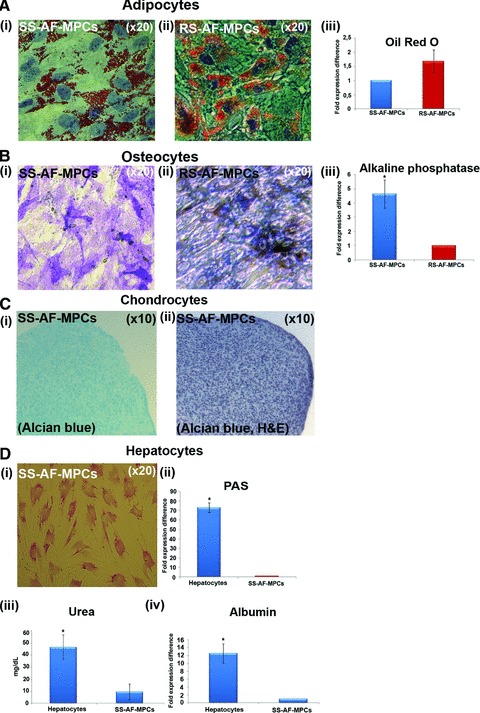
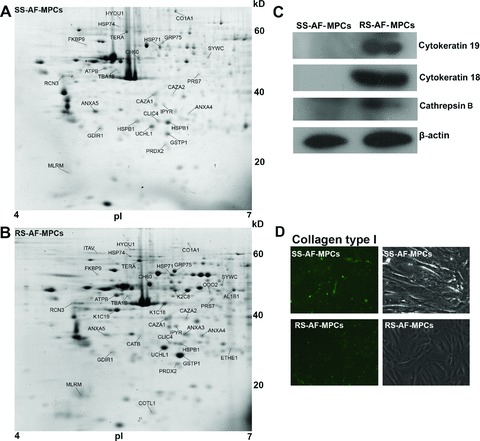
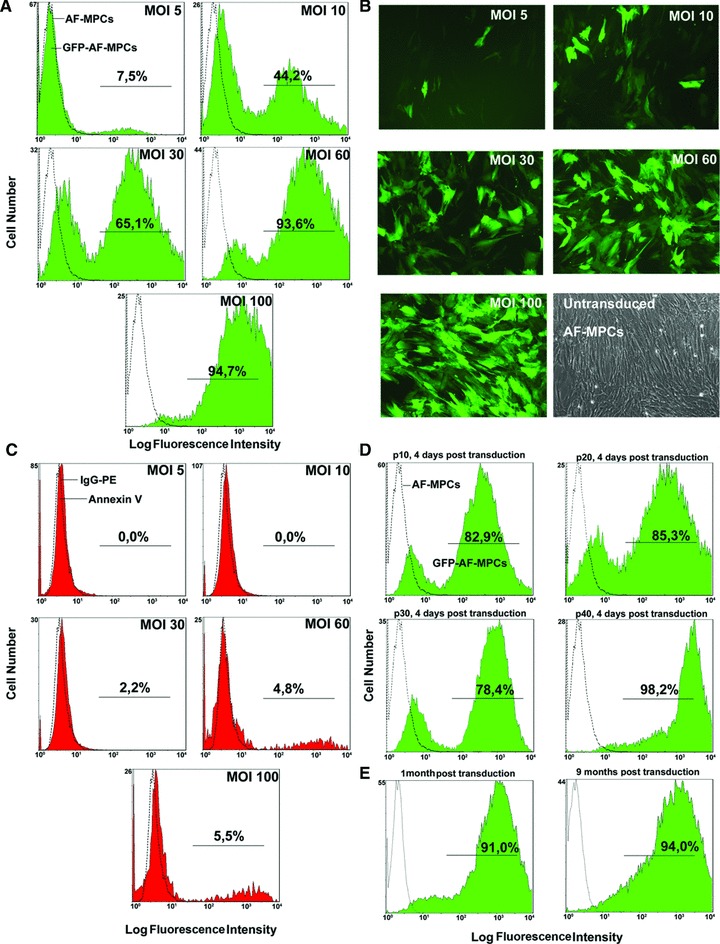
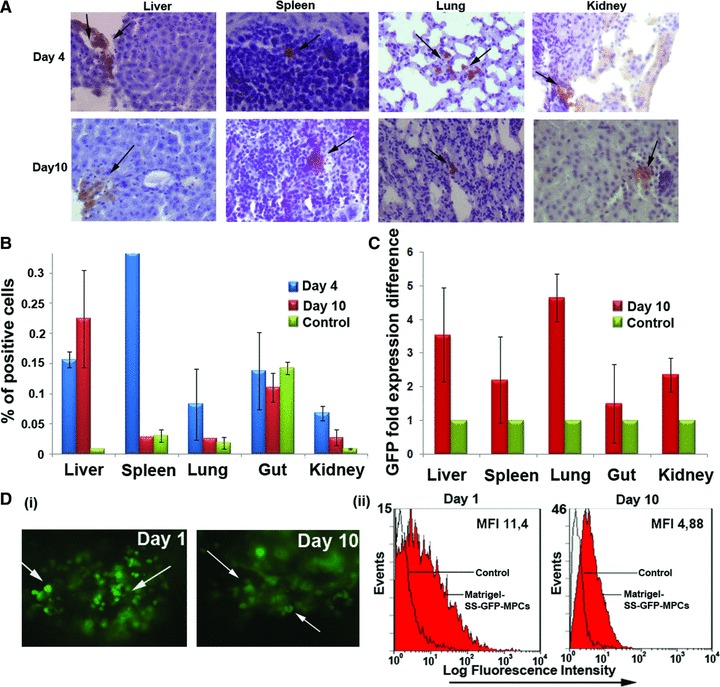
Human mesenchymal progenitor cells (MPCs) are considered to be of great promise for use in tissue repair and regenerative medicine. MPCs represent multipotent adherent cells, able to give rise to multiple mesenchymal lineages such as osteoblasts, adipocytes or chondrocytes. Recently, we identified and characterized human second trimester amniotic fluid (AF) as a novel source of MPCs. Herein, we found that early colonies of AF-MPCs consisted of two morphologically distinct adherent cell types, termed as spindle-shaped (SS) and round-shaped (RS). A detailed analysis of these two populations showed that SS-AF-MPCs expressed CD90 antigen in a higher level and exhibited a greater proliferation and differentiation potential. To characterize better the molecular identity of these two populations, we have generated a comparative proteomic map of SS-AF-MPCs and RS-AF-MPCs, identifying 25 differentially expressed proteins and 10 proteins uniquely expressed in RS-AF-MPCs. Furthermore, SS-AF-MPCs exhibited significantly higher migration ability on extracellular matrices, such as fibronectin and laminin in vitro, compared to RS-AF-MPCs and thus we further evaluated SS-AF-MPCs for potential use as therapeutic tools in vivo. Therefore, we tested whether GFP-lentiviral transduced SS-AF-MPCs retained their stem cell identity, proliferation and differentiation potential. GFP-SS-AF-MPCs were then successfully delivered into immunosuppressed mice, distributed in different tissues and survived longterm in vivo. In summary, these results demonstrated that AF-MPCs consisted of at least two different MPC populations. In addition, SS-AF-MPCs, isolated based on their colony morphology and CD90 expression, represented the only MPC population that can be expanded easily in culture and used as an efficient tool for future in vivo therapeutic applications.


Figures

Fig 1
Fig 1
Spindle- and round-shaped amniotic fluid mesenchymal progenitor cells. (A) Schematic representation of unselected AF-MPCs and mechanically selected colonies in an in vitro culture. (B) (i) AF-MPCs colonies morphology at p0, (ii) RS-AF-MPCs (p5) and (iii) SS-AF-MPCs (p5) morphology. Representative FACS histograms of (iv) AF-MPCs at p0, gated for CD90 expression (grey filled histograms), prior to analysis with the isotype-matched negative control (open histograms) at p0, (v) homogenous RS-AF-MPC at p5 and (vi) homogenous SS-AF-MPCs at p5 populations, respectively. (C) Comparative analysis of the percentage of proliferation of SS-AF-MPCs (blue line), RS-AF-MPCs (red line) and RS-AF-MPCs cultured in CM derived from SS-AF-MPCs (green line), during 6 days of culture by MTS assay. Values are mean ± S.D. for three independent samples from each MPC population.
Fig 2
Fig 2
Comparison of SS-AF-MPCs and RS-AF-MPCs expression patterns. (A) Representative FACS histograms of SS-AF-MPCs (grey filled histograms) and RS-AF-MPCs (opened histograms) gated for (i) CD166, (ii) CD73, (iii) CD146, (iv) CD105, (v) CD44 and (vi) CD49e markers, prior to analysis with (vii) the isotype-matched negative control. (B) SS- and RS-AF-MPCs analysed for different antigens expression by FACS analysis. The statistics were made on the mean MFI for each antigen. Isotype matched negative controls were used. Values are shown as mean ± S.D. for three independent samples from each type. Statistical analysis was performed using the Student’s t-test (*P < 0.05).
Fig 3
Fig 3
CD90 expression alteration according to the proliferation rate of SS-AF-MPCs. (A) Comparative analysis of the percentage of proliferation increase of SS-AF-MPCs at 37°C (grey line) and 33°C (light grey line), respectively during 6 days of culture. (B) Comparison of the percentage of expression of CD73, CD105 and CD90 (i) at day 1 and (ii) day 6 of culture at 37°C (grey bars) and 33°C (light grey bars) by FACS analysis, respectively. MFI values were normalized for each marker against the level of expression determined at 37°C, which was set to 100%. Values are shown as mean ± S.D. for three independent experiments. Statistical analysis was performed using the Student’s t-test (*P < 0.05; **P < 0.001).
Fig 4
Fig 4
Migration and adhesion properties of SS-AF-MPCs and RS-AF-MPCs. (A) (i) SS-AF-MPCs showed higher motility (**P < 0.001) on fibronectin and laminin, respectively compared to RS-AF-MPCs. (ii) Number of migrated SS-AF-MPCs to fibronectin in presence of CD44 neutralizing antibody or isotype matched non-specific antibody IgG1. (iii) Representative image (20×) of migrated SS-AF-MPCs fixed and stained using the Ral staining kit on the transwell membrane. (B) (i) Number of adherent SS-AF-MPCs and RS-AF-MPCs to fibronectin, treated with CD44, CD49e neutralizing antibodies or isotype matched non-specific antibody IgG1 in comparison to non treated SS-AF-MPCs and RS-AF-MPCs, respectively. (ii) Number of adherent SS-AF-MPCs and RS-AF-MPCs to hyalouronic acid, treated with CD44 neutralizing antibody or isotype matched non-specific antibody IgG1 in comparison to non treated SS-AF-MPCs and RS-AF-MPCs, respectively. (iii) Representative image (20×) of adherent cells fixed and stained using the Ral staining kit on the plastic vessel. Values are shown as mean ± S.D. for three independent experiments. Statistical analysis was carried out using the Student’s t-test (*P < 0.05; **P < 0.001).
Fig 5
Fig 5
Embryonic stem cell marker expression and differentiation potential of SS-AF-MPCs and RS-AF-MPCs. (A) Comparative analysis for the expression of oct-4, nanog and sox-2 in three SS-AF-MPCs and RS-AF-MPCs samples, respectively, analysed by RT-PCR. Results were first normalized to human GAPDH positive control and then to SS-AF-MPCs expression levels for each marker, respectively. Statistical analysis was performed using the Student’s t-test. (B) Immunofluorecent nuclear staining for (i–ii) Oct-4, (iii–iv) Sox-2 and (v–viii) DAPI (ix–xii) of SS-AF-MPCs and RS-AF-MPCs. Merge of DAPI staining and antibody staining. Original magnifications, 40×.
Fig 6
Fig 6
(A) Oil Red O staining for adipocyte differentiation properties of (i) SS-AF-MPCs and (ii) RS-AF-MPCs respectively, followed by (iii) quantitation analysis. (B) Alkaline phosphatase staining for osteocyte differentiation for (i) SS-AF-MPCs and (ii) RS-AF-MPCs respectively, followed by (iii) quantitation analysis. (C) (i) Alcian Blue and (ii) haematoxylin and eosin staining of SS-AF-MPCs, cultured under chondrogenic inducing conditions in pellet mass cultures. (D) PAS staining for hepatocyte differentiation for (i) SS-AF-MPCs induced to hepatocytes. (ii) Quantitation analysis for PAS staining, (iii) determination of the secreted Urea and (iv) albumin expression were shown. Quantitation of the respective differentiation assays was performed by using the Image J analysis software on 10 fields per image. For each sample, four images were taken. For adipogenic and osteogenic differentiation values were normalized in each case against the AF-MPC type with the lower differentiation capacity, which was set to 1, whereas for hepatogenic differentiation, values were normalized in each case against non-induced to differentiation SS-AF-MPCs. Values are mean ± S.D. from three samples from each type. Statistical analysis was performed using the Student’s t-test, *P < 0.05.
Fig 7
Fig 7
Two-dimensional gel electrophoretic analysis of AF-MPCs. (A) Representative 2D-gel electrophoresis image of proteins extracted from SS-AF-MPCs and (B) RS-AF-MPCs. The differentially and unique expressed protein spots in each population are indicated with their abbreviated names and listed in Tables S1–3, respectively. (C) Confirmation of the cytoskeratin 19 and 18 and cathepsin B expression by Western blot analysis with the respective antibodies in cell extracts from SS-AF-MPCs (lanes 1) and RS-AF-MPCs (lanes 2). Protein bands of 40, 54 and 38 kD corresponding to cytoskeratin 19 and 18 and cathepsin B heavy chain were detected. Immunoblotting for b-actin has been conducted to ensure the comparable loading of proteins in each lane. (D) Confirmation of the higher expression of collagen α1 (I) protein in SS-AF-MPCs compared to RS-AF-MPCs by immunofluorescent staining.
Fig 8
Fig 8
Transduction of SS-AF-MPCs with the pCCLsin.PPT.hPGK.GFP lentiviral system. (A) Flow cytometric analysis, (B) microscopic evaluation (20×) and (C) evaluation of apoptosis by Annexin V staining by FACS analysis of SS-AF-MPCs at MOI 5–100 and passage 16 (D) GFP efficiency of SS-AF-MPCs determined 4 days post-transduction at passages 10, 20, 30 and 40 by FACS analysis of MOI 60. (E) Stability of GFP expression 1 and 9 months post-transduction by FACS analysis at MOI 60.
Fig 9
Fig 9
In vivo engraftment of GFP transduced SS-AF-MPCs. (A) GFP-SS-AF-MPCs were trapped in different tissues as evaluated by immunohistochemistry, 4 and 10 days after transplantation. GFP-SS-AF-MPCs were found in liver, spleen, lung and kidney at low frequency. Immunohistochemistry was performed by using anti-GFP antibody. Quantitation of GFP cells was determined by (B) FACS analysis and (C) RT-PCR in the respective tissues 4 or 10 days post-injection where percentage of positive cells and GFP fold expression difference is presented, respectively. As negative controls, non-injected mice were used. Values are shown as mean ± S.D. for four mice in each group. (D) (i) Representative post-mortem fluorescent microscopy image of SS-AF-MPCs within the matrigel revealed a robust engraftment. (ii) FACS analysis of the disassociated matrigel area in presence of GFP transduced SS-AF-MPCs (red filled histogram) or GFP transduced SS-AF-MPCs in PBS (open histogram) 1 and 10 days post-transplantation.

References

    1. Smith JR, Pochampally R, Perry A, et al. Isolation of a highly clonogenic and multipotential subfraction of adult stem cells from bone marrow stroma. Stem Cells. 2004;22:823–31. - PubMed
    1. Sekiya I, Larson BL, Smith JR, et al. Expansion of human adult stem cells from bone marrow stroma: conditions that maximize the yields of early progenitors and evaluate their quality. Stem Cells. 2002;20:530–41. - PubMed
    1. Prockop DJ, Sekiya I, Colter DC. Isolation and characterization of rapidly self-renewing stem cells from cultures of human marrow stromal cells. Cytotherapy. 2001;3:393–6. - PubMed
    1. Colter DC, Sekiya I, Prockop DJ. Identification of a subpopulation of rapidly self-renewing and multipotential adult stem cells in colonies of human marrow stromal cells. Proc Natl Acad Sci U S A. 2001;98:7841–5. - PMC - PubMed
    1. Lee RH, Hsu SC, Munoz J, et al. A subset of human rapidly self-renewing marrow stromal cells preferentially engraft in mice. Blood. 2006;107:2153–61. - PubMed

Publication types

MeSH terms