

Phenotypic repertoire of the FNR regulatory network in Escherichia coli
- PMID: 21166900
- PMCID: PMC3075585
- DOI: 10.1111/j.1365-2958.2010.07437.x
Phenotypic repertoire of the FNR regulatory network in Escherichia coli
Abstract
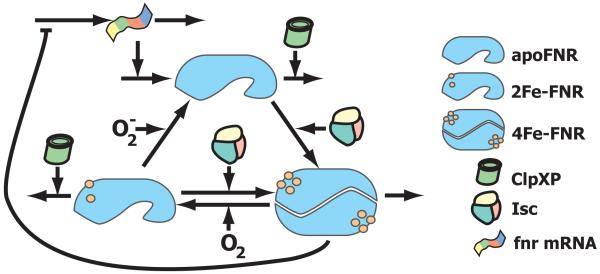
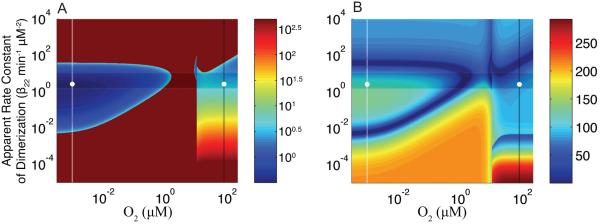
The FNR protein in Escherichia coli is an O(2) sensor that modifies global gene expression to adapt the cell to anaerobic growth. Regulation of FNR involves continuous cycling of the protein between its active and inactive states under aerobic conditions without apparent function. This raises the question of what benefit to the overall life cycle might compensate for the cost of cycling and reveals that the role of this process is poorly understood. To address this problem, we introduce the concept of a 'system design space', which provides a rigorous definition of phenotype at the molecular level and a means of visualizing the phenotypic repertoire of the system. Our analysis reveals undesirable and desirable phenotypes with an optimal constellation of parameter values for the system. To facilitate a more concrete understanding of what the design space represents, we analyse mutations that alter the apparent dimerization rate constant of FNR. We show that our estimated wild-type value of this rate constant, which is difficult to measure in situ, is located within this constellation and that the behaviour of the system is compromised in mutants if the value of the apparent dimerization rate constant lies beyond the bounds of this optimal constellation.
© 2010 Blackwell Publishing Ltd.
Figures
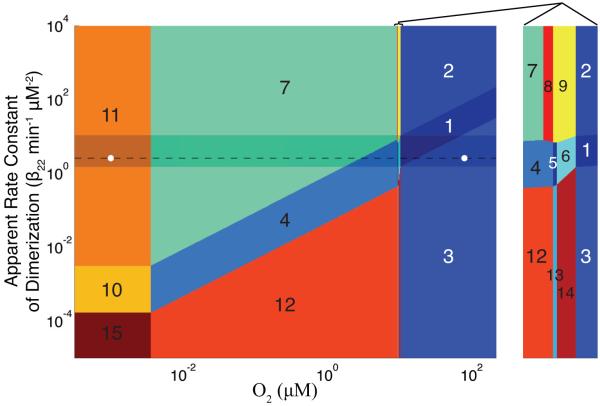
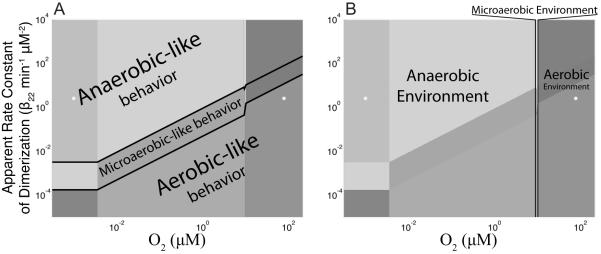
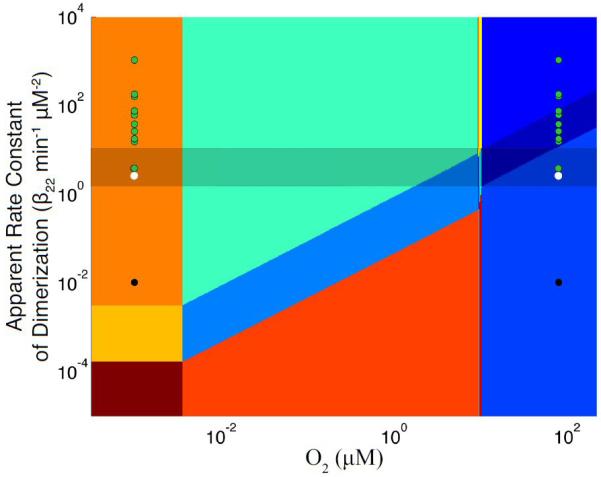
 ) or decreased (●) apparent rate constants for dimerization of monomeric FNR into active FNR. The position of each strain is shown under both aerobic (right set of points) and fully anaerobic (left set of points) conditions (see text for discussion).
Similar articles
-
Regulation of aerobic-to-anaerobic transitions by the FNR cycle in Escherichia coli.J Mol Biol. 2010 Apr 9;397(4):893-905. doi: 10.1016/j.jmb.2010.02.015. Epub 2010 Feb 12. J Mol Biol. 2010. PMID: 20156450 Free PMC article.
-
In vivo cycling of the Escherichia coli transcription factor FNR between active and inactive states.Microbiology (Reading). 2005 Dec;151(Pt 12):4063-4070. doi: 10.1099/mic.0.28253-0. Microbiology (Reading). 2005. PMID: 16339951
-
Covalently linking the Escherichia coli global anaerobic regulator FNR in tandem allows it to function as an oxygen stable dimer.Biochem Biophys Res Commun. 2012 Mar 2;419(1):43-8. doi: 10.1016/j.bbrc.2012.01.121. Epub 2012 Jan 31. Biochem Biophys Res Commun. 2012. PMID: 22326866
-
Cellular and molecular physiology of Escherichia coli in the adaptation to aerobic environments.J Biochem. 1996 Dec;120(6):1055-63. doi: 10.1093/oxfordjournals.jbchem.a021519. J Biochem. 1996. PMID: 9010748 Review.
-
Oxygen sensing by the global regulator, FNR: the role of the iron-sulfur cluster.FEMS Microbiol Rev. 1998 Dec;22(5):341-52. doi: 10.1111/j.1574-6976.1998.tb00375.x. FEMS Microbiol Rev. 1998. PMID: 9990723 Review.
Cited by
-
Bacterial adaptation of respiration from oxic to microoxic and anoxic conditions: redox control.Antioxid Redox Signal. 2012 Apr 15;16(8):819-52. doi: 10.1089/ars.2011.4051. Epub 2012 Jan 25. Antioxid Redox Signal. 2012. PMID: 22098259 Free PMC article. Review.
-
Design of the lac gene circuit revisited.Math Biosci. 2011 May;231(1):19-38. doi: 10.1016/j.mbs.2011.03.008. Epub 2011 Mar 21. Math Biosci. 2011. PMID: 21414326 Free PMC article. Review.
-
Fe-S proteins that regulate gene expression.Biochim Biophys Acta. 2015 Jun;1853(6):1284-93. doi: 10.1016/j.bbamcr.2014.11.018. Epub 2014 Nov 20. Biochim Biophys Acta. 2015. PMID: 25450978 Free PMC article. Review.
-
Strategy revealing phenotypic differences among synthetic oscillator designs.ACS Synth Biol. 2014 Sep 19;3(9):686-701. doi: 10.1021/sb500236e. Epub 2014 Jul 24. ACS Synth Biol. 2014. PMID: 25019938 Free PMC article.
-
Strategies for manipulation of oxygen utilization by the electron transfer chain in microbes for metabolic engineering purposes.J Ind Microbiol Biotechnol. 2017 May;44(4-5):647-658. doi: 10.1007/s10295-016-1851-6. Epub 2016 Oct 31. J Ind Microbiol Biotechnol. 2017. PMID: 27800562 Review.
References
-
- Crack JC, Gaskell AA, Green J, Cheesman MR, Le Brun NE, Thomson AJ. Influence of the environment on the [4Fe-4S]2+ to [2Fe-2S]2+ cluster switch in the transcriptional regulator FNR. Journal of the American Chemical Society. 2008;130:1749–1758. - PubMed
-
- Giel JL, Rodionov D, Liu M, Blattner FR, Kiley PJ. IscR-dependent gene expression links iron-sulphur cluster assembly to the control of O2-regulated genes in Escherichia coli. Mol Microbiol. 2006;60:1058–1075. - PubMed
Publication types
MeSH terms
Substances
Grants and funding
LinkOut - more resources
Full Text Sources
