. 2010 Dec 17:4:170.
doi: 10.1186/1752-0509-4-170.

Inference of hierarchical regulatory network of estrogen-dependent breast cancer through ChIP-based data

Affiliations

Inference of hierarchical regulatory network of estrogen-dependent breast cancer through ChIP-based data

Fei Gu et al. BMC Syst Biol. .

Abstract

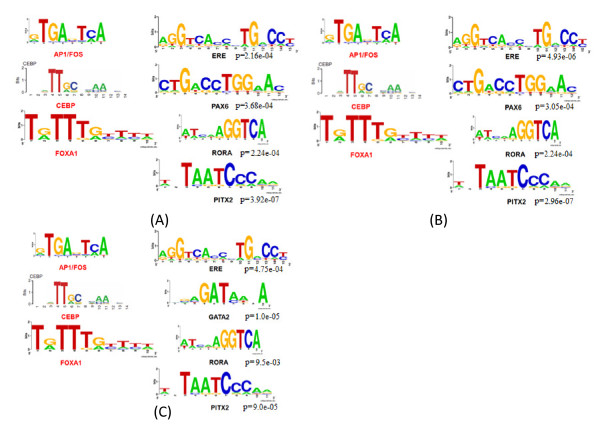
Background: Global profiling of in vivo protein-DNA interactions using ChIP-based technologies has evolved rapidly in recent years. Although many genome-wide studies have identified thousands of ERα binding sites and have revealed the associated transcription factor (TF) partners, such as AP1, FOXA1 and CEBP, little is known about ERα associated hierarchical transcriptional regulatory networks.

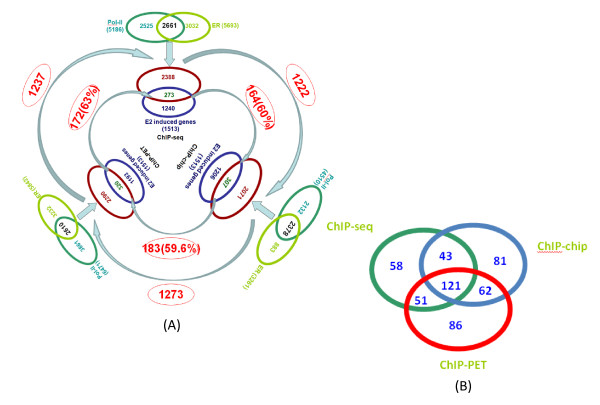
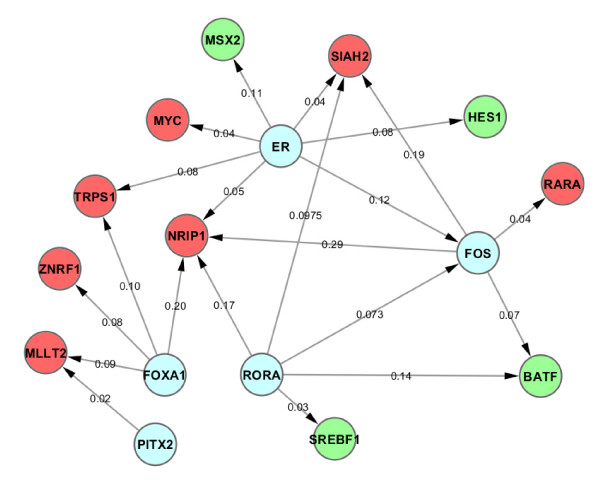
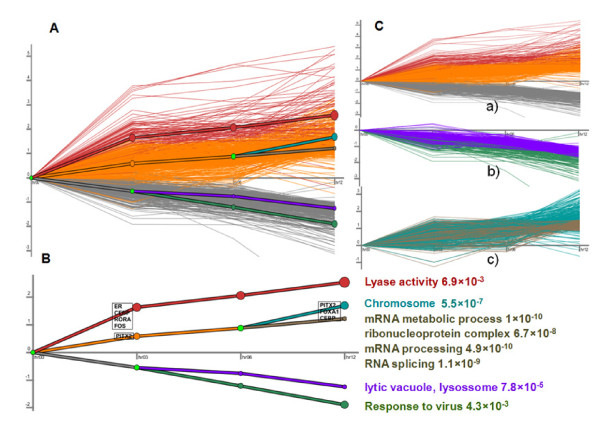
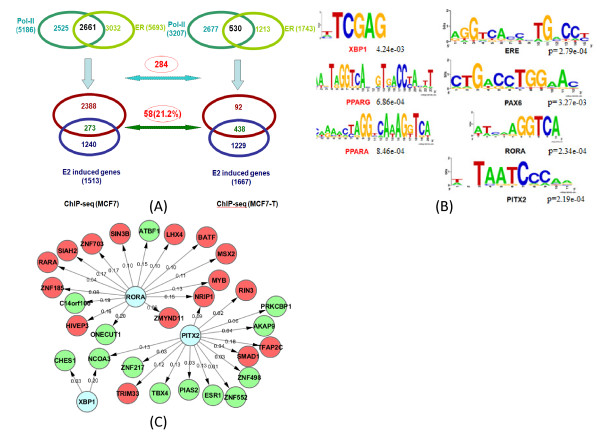
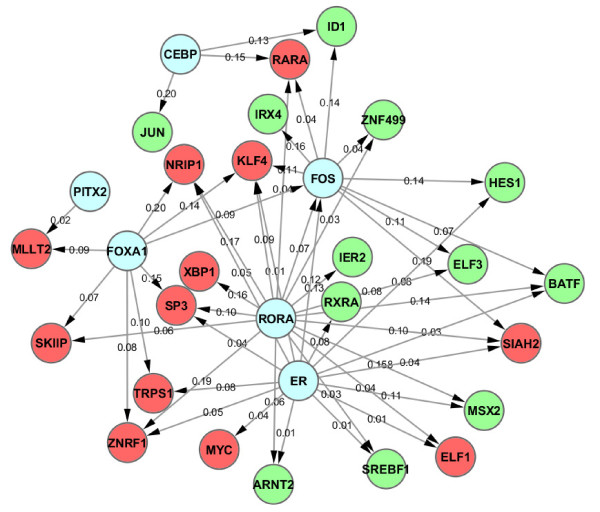
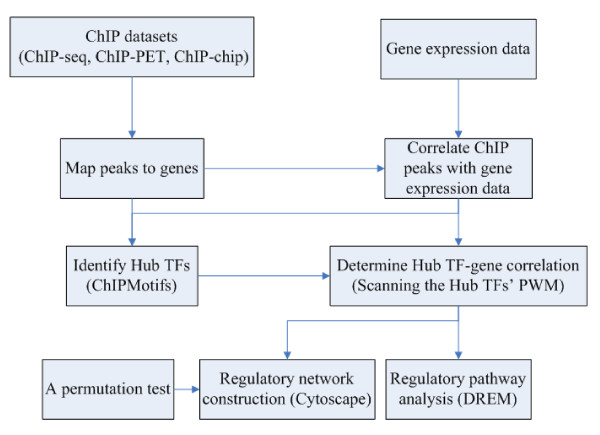
Results: In this study, we applied computational approaches to analyze three public available ChIP-based datasets: ChIP-seq, ChIP-PET and ChIP-chip, and to investigate the hierarchical regulatory network for ERα and ERα partner TFs regulation in estrogen-dependent breast cancer MCF7 cells. 16 common TFs and two common new TF partners (RORA and PITX2) were found among ChIP-seq, ChIP-chip and ChIP-PET datasets. The regulatory networks were constructed by scanning the ChIP-peak region with TF specific position weight matrix (PWM). A permutation test was performed to test the reliability of each connection of the network. We then used DREM software to perform gene ontology function analysis on the common genes. We found that FOS, PITX2, RORA and FOXA1 were involved in the up-regulated genes.We also conducted the ERα and Pol-II ChIP-seq experiments in tamoxifen resistance MCF7 cells (denoted as MCF7-T in this study) and compared the difference between MCF7 and MCF7-T cells. The result showed very little overlap between these two cells in terms of targeted genes (21.2% of common genes) and targeted TFs (25% of common TFs). The significant dissimilarity may indicate totally different transcriptional regulatory mechanisms between these two cancer cells.

Conclusions: Our study uncovers new estrogen-mediated regulatory networks by mining three ChIP-based data in MCF7 cells and ChIP-seq data in MCF7-T cells. We compared the different ChIP-based technologies as well as different breast cancer cells. Our computational analytical approach may guide biologists to further study the underlying mechanisms in breast cancer cells or other human diseases.


Figures

Figure 1
Figure 1
Summary of correlations of identified ERα, Pol-II binding peaks with gene expression profile after E2-induced in MCF7 cells. (A) Genes with both ER and Pol-II peak binding in the gene region (between 100 kb upstream of TSS and 100 kb downstream of 3' UTR), 2661 (273 common genes overlapped with gene expression data) for ChIP-seq, 2610 (320 common genes overlapped with gene expression data)for ChIP-PET dataset and 2378 (307 common genes overlapped with gene expression data) for ChIP-chip dataset, respectively. 172(~63%) common genes were found between ChIP-seq and ChIP-PET, this number was higher than the common genes number between ChIP-seq and ChIP-chip (164, ~60%) and common genes number between ChIP-chip and ChIP-PET (183, ~59.6%). (B) The overlapped number of genes of three different technologies.
Figure 2
Figure 2
List of transcription factor motifs identified by our de novo ChIPMotifs approach. (A) ChIP-seq, (B) ChIP-PET, and (C) ChIP-chip.
Figure 3
Figure 3
The regulatory network for E2 treated MCF7 cells, combining with 3 different ChIP-based datasets. Red nodes represented for up-regulated genes, green nodes represented for down-regulated genes, and blue nodes represented for Hub TFs.
Figure 4
Figure 4
Regulatory pathway analysis on the dataset after combining with all three ChIP-based datasets. A) The time series gene expression data of E2 induced genes superimposed with the regulatory pathway map produced by DREM using the gene expression profile as well as ERα binding sites and Pol-II binding sites. The bright green nodes indicate split points where the sets of expression of genes diverge. B) Paths out of splits are annotated with TFs determined by DREM to be associated with the genes assigned to the path at a score <0.1. The GO annotations for the genes in 5 of the paths are shown at the right with their p-values. C) The genes traversing the 3 splits are shown with (a) corresponding to the split at 0-hr, (b) corresponding to the split at 3-hr and (c) corresponding to the split at 6-hr.
Figure 5
Figure 5
Peak number, Motif and Regulatory network of MCF7-T cells. (A) Comparison of common genes between MCF7 and MCF7-T cells in ChIP-seq dataset. Genes with both ER and Pol-II peak binding in the gene region (between 100 kb upstream of TSS and 100 kb downstream of 3' UTR), 2661 (273 common genes overlapped with gene expression data) for MCF7 cells, 530 (438 common genes overlapped with gene expression data) for MCF7-T cells, respectively. 58(~21.2%) common genes were found between MCF7 and MCF7-T cells. (B) Transcription factor motifs identified by our de novo ChIPMotifs approach for MCF7-T cells. (C) The Regulatory network for E2 treated MCF7-T cells.
Figure 6
Figure 6
The Regulatory network for E2 treated MCF7 cells, combining with 2 different ChIP-based datasets: ChIP-seq and ChIP-PET. Total 30 nodes (TFs) were found in the network. This number is approximately 60% of the nodes in the network of ChIP-seq/ChIP-PET only.
Figure 7
Figure 7
A summary of the computational analytical approach.

References

    1. Kim TH, Barrera LO, Zheng M, Qu CX, Singer MA, Richmond TA, Wu YN, Green RD, Ren B. A high-resolution map of active promoters in the human genome. Nature. 2005;436:876–880. doi: 10.1038/nature03877. - DOI - PMC - PubMed
    1. Ren B, Robert F, Wyrick JJ, Aparicio O, Jennings EG, Simon I, Zeitlinger J, Schreiber J, Hannett N, Kanin E, Volkert TL, Wilson CJ, Bell SP, Young RA. Genome-wide location and function of DNA binding proteins. Science. 2000;290:2306–2309. doi: 10.1126/science.290.5500.2306. - DOI - PubMed
    1. Weinmann AS, Yan PS, Oberley MJ, Huang TH, Farnham PJ. Isolating human transcription factor targets by coupling chromatin immunoprecipitation and CpG island microarray analysis. Genes Dev. 2002;16:235–244. doi: 10.1101/gad.943102. - DOI - PMC - PubMed
    1. Wu J, Smith LT, Plass C, Huang TH. ChIP-on-chip comes of age for genome-wide functional analysis. Cancer Res. 2006;66:6899–6902. doi: 10.1158/0008-5472.CAN-06-0276. - DOI - PubMed
    1. Roh TY, Cuddapah S, Cui K, Zhao K. The genomic landscape of histone modifications in human T cells. Proc Natl Acad Sci USA. 2006;103:15782–15787. doi: 10.1073/pnas.0607617103. - DOI - PMC - PubMed

Publication types

MeSH terms