. 2011 Feb;94(1-2):44-52.
doi: 10.1016/j.prostaglandins.2010.12.003. Epub 2010 Dec 15.

Endotoxin activates de novo sphingolipid biosynthesis via nuclear factor kappa B-mediated upregulation of Sptlc2

Affiliations

Endotoxin activates de novo sphingolipid biosynthesis via nuclear factor kappa B-mediated upregulation of Sptlc2

Zhi-Qiang Chang et al. Prostaglandins Other Lipid Mediat. 2011 Feb.

Abstract

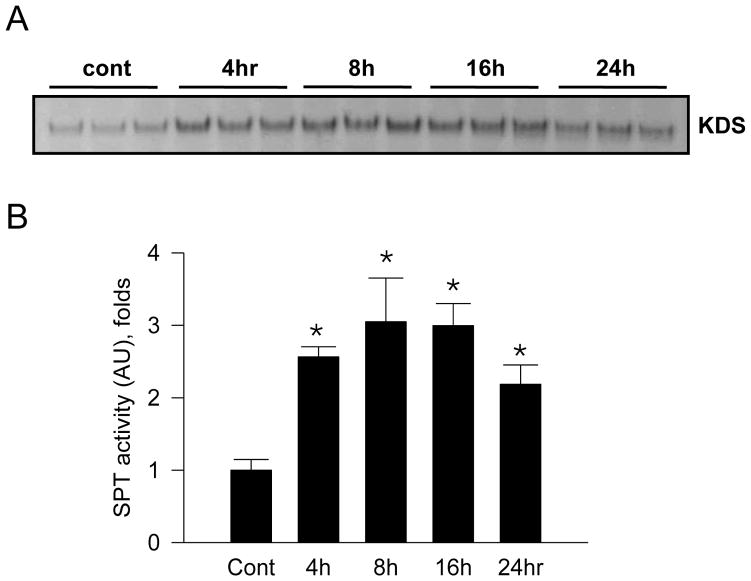
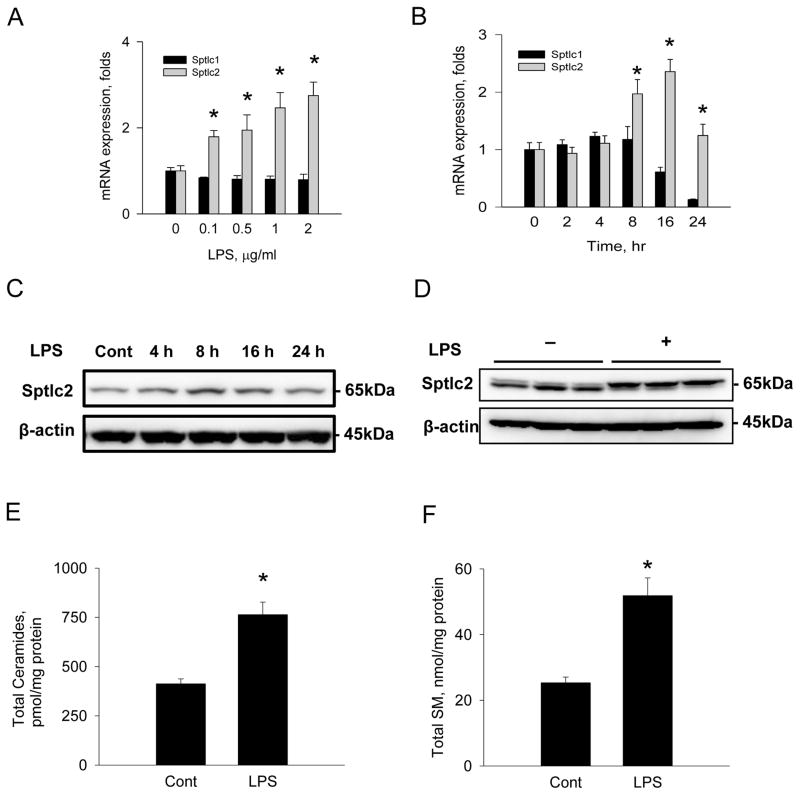
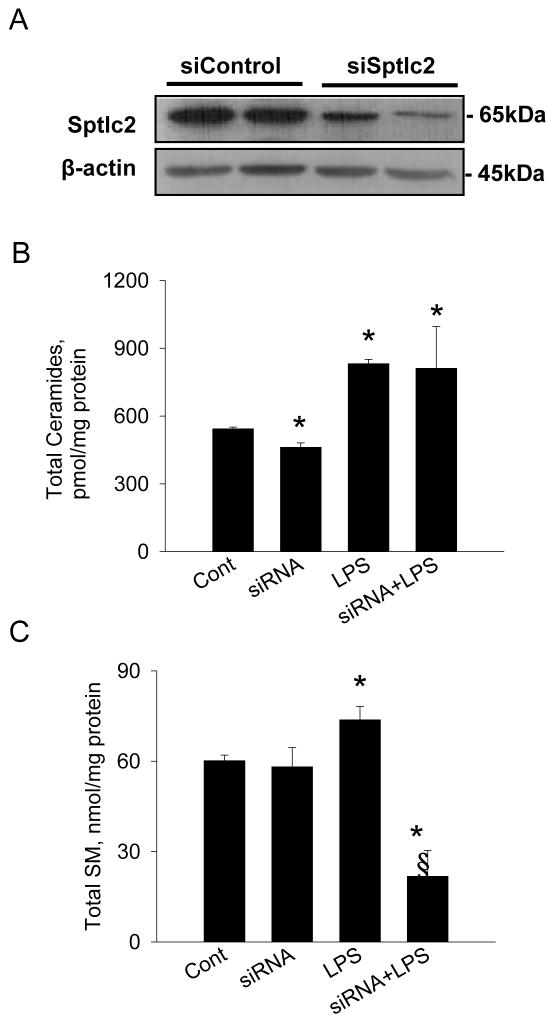
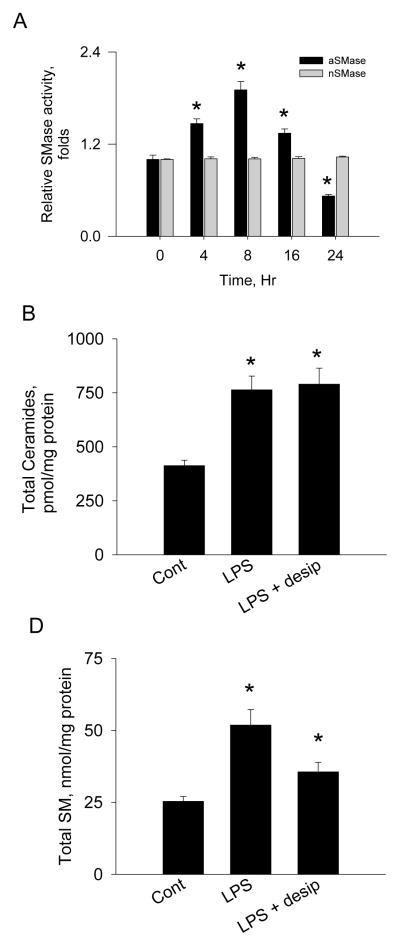
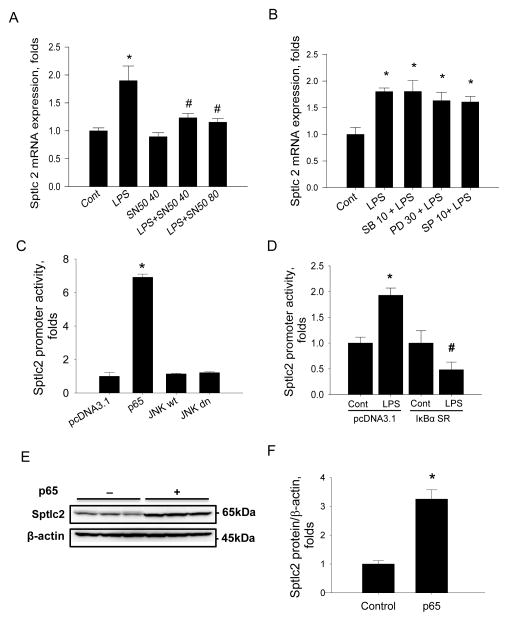
Sphingolipids are membrane components and are involved in cell proliferation, apoptosis and metabolic regulation. In this study we investigated whether de novo sphingolipid biosynthesis in macrophages is regulated by inflammatory stimuli. Lipopolysaccharide (LPS) treatment upregulated Sptlc2, a subunit of serine palmitoyltransferase (SPT), mRNA and protein in Raw264.7 and mouse peritoneal macrophages, but Sptlc1, another subunit of SPT, was not altered. SPT activation by LPS elevated cellular levels of ceramides and sphingomyelin (SM). Pharmacological inhibition of nuclear factor kappa B (NFκB) prevented LPS-induced upregulation of Sptlc2 while transfection of p65 subunit of NFκB upregulated Sptlc2 and increased cellular ceramide levels. In contrast, MAP kinases were not involved in regulation of sphingolipid biosynthesis. Analysis of Sptlc2 promoter and chromatin immunoprecipitation (ChIP) assay showed that NFκB binding sites are located in Sptlc2 promoter region. Our results demonstrate that inflammatory stimuli activate de novo sphingolipid biosynthesis via NFκB and may play a critical role in lipid metabolism in macrophages.


Figures

Figure 1
Figure 1
Activation of serine palmitoyltransferase (SPT) by LPS in Raw264.7 cells. Raw264.7 macrophage cells were incubated with 1 μg/ml LPS at various times. SPT activity of microsomal fraction (100 μg protein) was measured by using [14C]-serine and palmitoyl CoA as substrates. Lipid fractions were extracted and analyzed by TLC followed by autoradiography (A). The bands indicate ketodihydrosphingosine (KDS). The radioactivity of lipid fractions was measured by scintillation counter (B). n=3, mean ± SEM, *p<0.05 vs. control. Results are representative of two independent experiments.
Figure 2
Figure 2
Upregulation of Sptlc2 expression and altered sphingolipid profile by LPS. Raw264.7 macrophage cells were incubated with various concentrations of LPS for 8 hrs (A) and various incubation times with 1 μg/ml LPS (B). mRNA was isolated and expression of Sptlc1 and Sptlc2 were measured by real-time PCR. Raw264.7 cells were incubated with 1 μg/ml LPS for 8 hrs and the cell extracts were analyzed by SDS-PAGE followed by immunoblotting with anti-Sptlc2 antibody (C). Primary peritoneal macrophages were isolated from C57Bl6/J wild-type mice and incubated with 1 μg/ml LPS for 8 hrs (D). Sphingolipids were extracted from Raw264.7 cells incubated with LPS for 8 hrs and analyzed by LC/MS/MS as described in Materials and Methods. Total ceramides (E) and SM (F) were quantified. n =3, Page 37 of 42 mean ± SEM, *p<0.05 vs. control. Results are respresentative of three independent experiments.
Figure 3
Figure 3
Suppression of Sptlc2 expression by Sptlc2 siRNA and altered sphingolipid profile. Raw264.7 cells were transfected with Sptlc2-siRNA for 72 hrs and Sptlc2 proteins were immunoblotted with Sptlc2-antibody (A). Cells transfected with the control siRNA (siControl) and Sptlc2-siRNA (siSptlc2) were incubated with LPS for 8 hrs. Sphingolipids were extracted and analyzed by LC/MS/MS as described in Materials and Methods. Total ceramides (B) and SM (C) were quantified. n=3, mean ± SEM, *p<0.05 vs. control. § p<0.05 vs. LPS. Results are representative of three independent experiments.
Figure 4
Figure 4
Activation of acid SMase by LPS. Raw264.7 cells were incubated with LPS at various times. LPS-treated cells were extracted and acid and neutral SMase activities were measured using [14C]-SM as substrates (A). Cells were incubated with LPS and desipramine (desip) for 8 hrs. Sphingolipids were extracted and analyzed by LC/MS/MS as described in Materials and Methods. Total ceramides (B) and SM (C) were quantified. n =3, mean ± SEM, *p<0.05 vs. control. Results are representative of two independent experiments.
Figure 5
Figure 5
Involvement of inflammatory response pathways in regulation of Sptlc2 expression by LPS in Raw264.7 cells. Cells were incubated with 40 and 80 μM SN50 (A) or 10 μM SB203580 (SB), 30 μM PD98059 (PD), 10 μM SP600125 (SP) (B) respectively in the presence or absence of 1 μg/ml LPS for 8 hrs. Expression of Sptlc2 was measured by RT-PCR. pGL3 reporter construct containing Sptlc2 promoter (-2049~-54) was co-transfected with empty pcDNA3.1, p65, wild-type JNK (JNKwt) or dominant negative JNK (JNKdn) respectively. After 24 hrs incubation, the luciferase activity was measured by Dual-Luciferse Reporter Assay (C). After co-transfection of pcDNA3.1 empty vector or IκBα super-repressor vector (IκBα SR) with Sptlc2 reporter construct and 8 hrs incubation with 1 μM LPS, the activity of luciferase was measured (D). Raw264.7 cells were transfected with pcDNA 3.1 empty vector or pcDNA3.1-p65 vector and incubated for 24 hrs, Sptlc2 protein level were determined by immunoblot (E) and quantified by densitometry (F). Expression of Sptlc2 was normalized by β-actin. n=3, mean ± SEM, *p<0.05 vs. control, #p<0.05 vs LPS with pcDNA3.1 empty vector. Results are representative of two independent experiments.
Figure 6
Figure 6
Promoter analysis of Sptlc2 by NFκB in Raw264.7 cells. Sptlc2 reporter construct with various lengths of Sptlc2 promoter were co-transfected with pcDNA2.1 empty vector or pcDNA2.1-p65 vector and the luciferase activity was measured (A). Raw264.7 cells were incubated with 1 μg/ml LPS for 8 hrs and chromatin was immunoprecipitated by anti-p65 antibody. Immunoprecipitaed chromatin DNA was fragmented by sonication to produce 0.2~0.4 kb DNA fragments. PCR was performed to measure the promoter region of -449~-250 and -845~-650 (B). n=3, mean ± SEM. §p<0.05 vs. empty control. #p<0.05 vs. -849 promoter. *p<0.05 vs. -449 promoter. Results are respresentative of two independent experiments.

References

    1. Pettus BJ, Chalfant CE, Hannun YA. Ceramide in apoptosis: an overview and current perspectives. Biochim Biophys Acta. 2002;1585:114–25. - PubMed
    1. Chavez JA, Summers SA. Characterizing the effects of saturated fatty acids on insulin signaling and ceramide and diacylglycerol accumulation in 3T3-L1 adipocytes and C2C12 myotubes. Arch Biochem Biophys. 2003;419:101–9. - PubMed
    1. Park TS, Panek RL, Mueller SB, Hanselman JC, Rosebury WS, Robertson AW, et al. Inhibition of sphingomyelin synthesis reduces atherogenesis in apolipoprotein E-knockout mice. Circulation. 2004;110:3465–71. - PubMed
    1. Holland WL, Brozinick JT, Wang LP, Hawkins ED, Sargent KM, Liu Y, et al. Inhibition of ceramide synthesis ameliorates glucocorticoid-, saturated-fat-, and obesity-induced insulin resistance. Cell Metab. 2007;5:167–79. - PubMed
    1. Park TS, Hu Y, Noh HL, Drosatos K, Okajima K, Buchanan J, et al. Ceramide is a cardiotoxin in lipotoxic cardiomyopathy. J Lipid Res. 2008;49:2101–12. - PMC - PubMed

Publication types

LinkOut - more resources