. 2011 Mar 15;55(2):468-78.
doi: 10.1016/j.neuroimage.2010.12.032. Epub 2010 Dec 16.

Age-associated reductions in cerebral blood flow are independent from regional atrophy

Affiliations

Age-associated reductions in cerebral blood flow are independent from regional atrophy

J Jean Chen et al. Neuroimage. .

Abstract

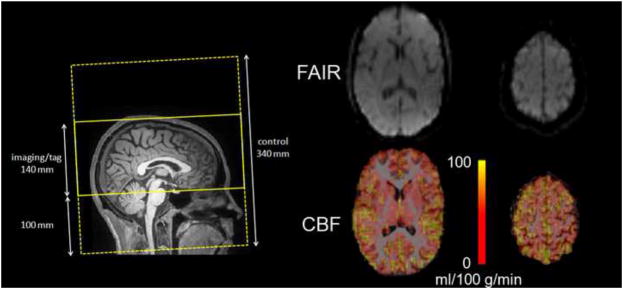
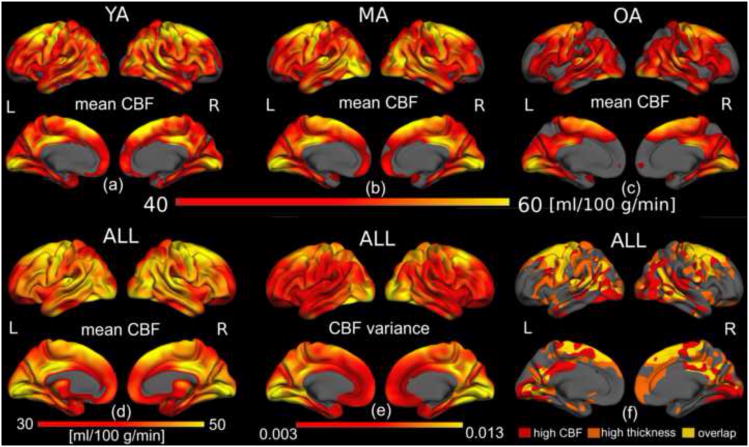
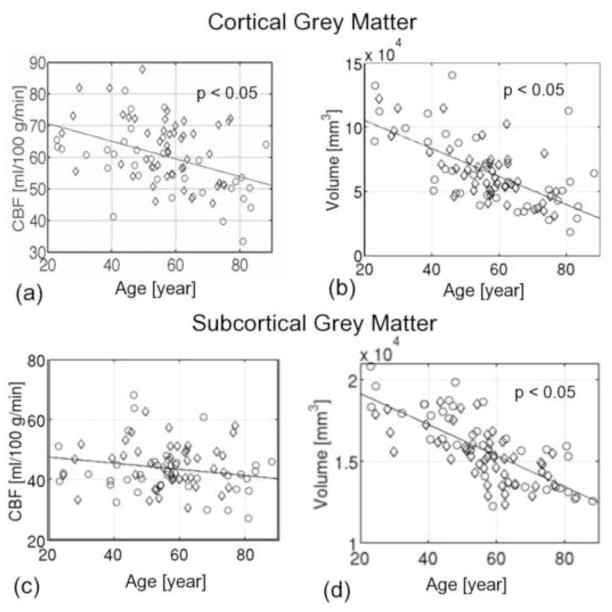
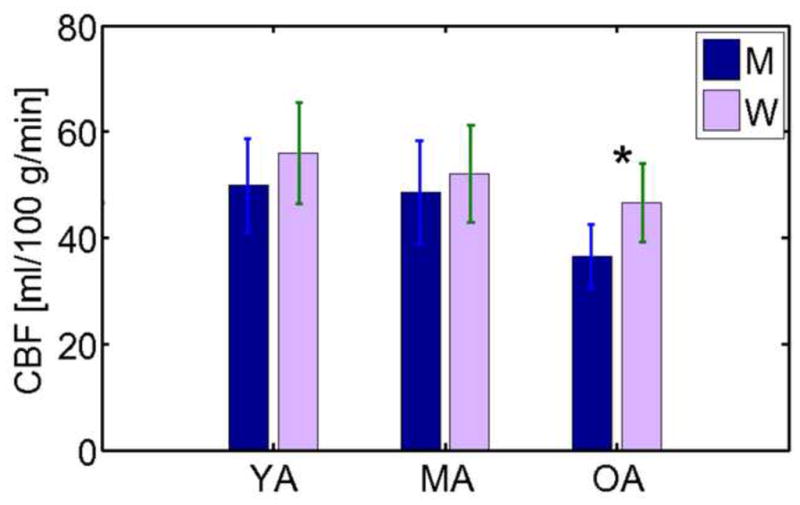
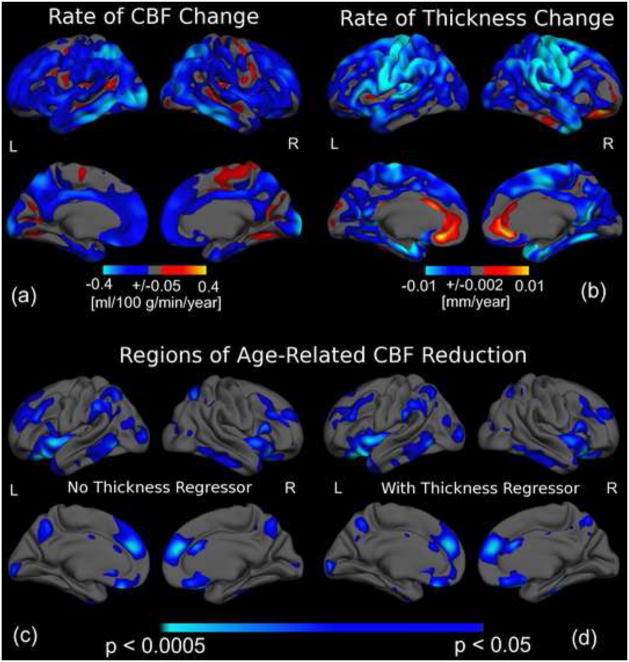
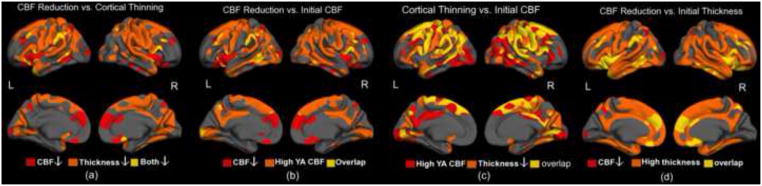
Prior studies have demonstrated decreasing cerebral blood flow (CBF) in normal aging, but the full spatial pattern and potential mechanism of changes in CBF remain to be elucidated. Specifically, existing data have not been entirely consistent regarding the spatial distribution of such changes, potentially a result of neglecting the effect of age-related tissue atrophy in CBF measurements. In this work, we use pulsed arterial-spin labelling to quantify regional CBF in 86 cognitively and physically healthy adults, aged 23 to 88 years. Surface-based analyses were utilized to map regional decline in CBF and cortical thickness with advancing age, and to examine the spatial associations and dissociations between these metrics. Our results demonstrate regionally selective age-related reductions in cortical perfusion, involving the superior-frontal, orbito-frontal, superior-parietal, middle-inferior temporal, insular, precuneus, supramarginal, lateral-occipital and cingulate regions, while subcortical CBF was relatively preserved in aging. Regional effects of age on CBF differed from that of grey-matter atrophy. In addition, the pattern of CBF associations with age displays an interesting similarity with the default-mode network. These findings demonstrate the dissociation between regional CBF and structural alterations specific to normal aging, and augment our understanding of mechanisms of pathology in older adults.


Figures

Figure 1
Figure 1
The tagging and acquisition regions for the PASL scan are illustrated on the left. The PASL raw image and CBF maps (registered to the T1-weighted anatomical images) are shown for an inferior (acquired earlier) and superior (acquire later) slice. The CBF maps demonstrate the expected PASL signal in cortical regions and subcortical grey matter, and low signal in white matter.
Figure 2
Figure 2
Quantitative CBF values across the cortex. Average cortical quantitative CBF for the YA (a), MA (b) and OA (c) groups were mapped onto semi-inflated lateral (top) and medial (bottom) surface models. Across all groups, the highest resting CBF was found to be associated mainly with visual and motor areas, in addition to the superior frontal region and the posterior cingulate, confirmed in the average over all subjects (d). The variance in CBF across cortical regions is demonstrated in (e), and may affect the statistical power of age effects. Lastly, the spatial variation in CBF is similar across age-groups, with the older-adults showing visibly reduced CBF. Regions of high mean basal CBF did not directly translate to high cortical thickness (f).
Figure 3
Figure 3
Association between global cortical CBF, tissue volume and age. Men are indicated by circles and women by diamonds, and regression models are shown as solid lines. The mean CBF across the entire cortex was negatively correlated with age (a), with a slope of −0.38% per year (p < 0.05). Cortical grey matter volume, normalized by total intracranial volume, also shows a negative association with age, with a slope of 0.85% per year (p < 0.05), exceeding concurrent reductions in CBF. On the other hand, the CBF averaged across all subcortical structures did not significantly vary with age (c), while subcortical grey-matter volume variations were associated with a slope of −0.44% per year (p < 0.05). All volume measures were corrected for intracranial volume (eTIV).
Figure 4
Figure 4
Global average CBF values in the cortex. Cortical CBF in young (YA), middle aged (MA), and older adults (OA) differentiated by sex (men, M, and women, F). The average CBF across the entire cortex was higher in women in the OA group (denoted by asterisk), but there was no gender-dependence globally in the YA or MA groups. Also evident from this group comparison is a trend for OA to have reduced CBF compared to YA and MA, although the difference eluded statistical significant for either the men or the women.
Figure 5
Figure 5
Mean CBF values in subcortical grey-matter volumes and in the hippocampus, as labelled in (a), demonstrate a difference between men (M) and women (W) for the OA age-group only (b).
Figure 6
Figure 6
The association between age and regional CBF as well as cortical thickness. The colour scale in (a) indicates the amplitude of age-associations in CBF, while those in (b) and (c) indicate statistical significance, with light blue and yellow denoting the strongest negative and positive associations, respectively. Regions exhibiting the largest magnitude of CBF reduction (a) and cortical thinning with age (b) did not spatially coincide. The significance map of CBF reductions before (c) and after vertex-wise covariation for age-associations in cortical-thickness (d) only subtly differed. Greatest statistical effects were found in the left supramarginal and occipital gyri, and the right anterior cingulate, as well as bilaterally in the right rostral middle-frontal, superior parietal, middle-inferior temporal and insular regions, medial superior frontal, orbito-frontal and precuneus regions. Furthermore, the localization of regions exhibiting the most rapid age-related CBF decline appeared to coincide with regions showing the highest statistical effects of age on CBF.
Figure 7
Figure 7
Associations between resting CBF, cortical thickness and their respective magnitudes of age-association. Regions of high thickness and CBF were defined as those with values exceeding the cortical mean. There was minimal overlap between regions showing age-associated cortical thinning and regions showing age-related decrease in CBF (a). Regions showing the highest CBF in youth (represented by mean CBF in YA group) were not necessarily those showing the greatest cross-sectional age-associated CBF reductions (b). Interestingly, there was substantially more overlap between regions of largest CBF and thickness reductions, although the overlap did not encompass all regions manifesting cortical thinning (c). Finally, almost all regions of high cortical thickness are associated with significant CBF reduction, the latter having been controlled for concurrent thickness decrease (d).

References

    1. Aguero-Torres H, Kivipelto M, von Strauss E. Rethinking the dementia diagnoses in a population-based study: What is Alzheimer’s disease and what is vascular dementia? A study from the Kungsholmen project. Dementia and Geriatric Cognitive Disorders. 2006;22:244–249. - PubMed
    1. Akiyama H, Meyer JS, Mortel KF, Terayama Y, Thornby JI, Shizuko K. Normal human aging: factors contributing to cerebral atrophy. Journal of the Neurological Sciences. 1997;152:39–49. - PubMed
    1. Alsop DC, Casement M, de Bazelaire C, Fong T, Press DZ. Hippocampal hyperperfusion in Alzheimer’s disease. NeuroImage. 2008;42:1267–1274. - PMC - PubMed
    1. Alsop DC, Dai W, Grossman M, Detre JA. Arterial spin labeling blood flow MRI: its role in the early characterization of Alzheimer’s disease. J Alzheimers Dis. 2010;20:871–880. - PMC - PubMed
    1. Alves TC, Busatto GF. Regional cerebral blood flow reductions, heart failure and Alzheimer’s disease. Neurological Research. 2006;28:579–587. - PubMed

Publication types