. 2010 Dec 23;143(7):1047-58.
doi: 10.1016/j.cell.2010.12.002.

Breaking the diffraction barrier: super-resolution imaging of cells

Affiliations

Breaking the diffraction barrier: super-resolution imaging of cells

Bo Huang et al. Cell. .

Abstract

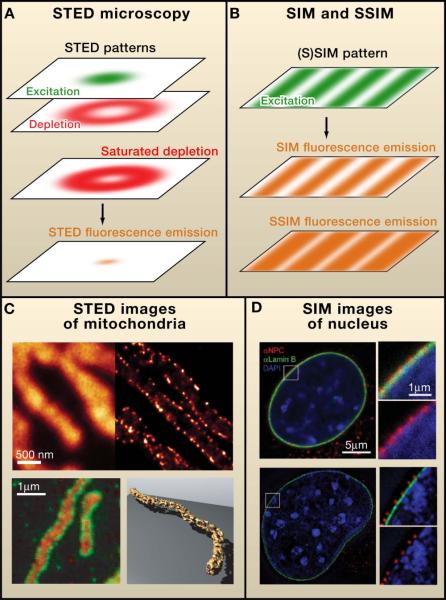
Anyone who has used a light microscope has wished that its resolution could be a little better. Now, after centuries of gradual improvements, fluorescence microscopy has made a quantum leap in its resolving power due, in large part, to advancements over the past several years in a new area of research called super-resolution fluorescence microscopy. In this Primer, we explain the principles of various super-resolution approaches, such as STED, (S)SIM, and STORM/(F)PALM. Then, we describe recent applications of super-resolution microscopy in cells, which demonstrate how these approaches are beginning to provide new insights into cell biology, microbiology, and neurobiology.


Figures

Figure 1
Figure 1
Diffraction-Limited Resolution of Conventional Light Microscopy (A) The focal spot of a typical objective with high numerical aperture, depicted by the cyan ellipsoid, has a width of ~250 nm in the lateral directions and ~550 nm in the axial direction. The image of a point emitter imaged through the objective, namely the point spread function, also has similar widths. These widths define the diffraction-limited resolution. Two objects separated by a distance larger than this resolution limit appear as two separate entities in the image. Otherwise, they appear as a single entity (i.e., unresolvable). These two cases are exemplified by the two cross sections of the microtubule image, cyan curves A and B in the right panel, at the corresponding positions indicated by the white lines in the middle panel. (B) The size scale of various biological structures in comparison with the diffraction-limited resolution. (Left to right) A mammalian cell, a bacterial cell, a mitochondrion, an influenza virus, a ribosome, the green fluorescent protein, and a small molecule (thymine).
Figure 2
Figure 2
Super-Resolution Fluorescence Microscopy by Patterned Illumination (A) In stimulated emission depletion (STED) microscopy, fluorophores are excited by a focused light beam (green, top layer), and an additional depletion light beam (red, second layer) is used to bring molecules back to the ground state by a process called stimulated emission. The intensity profile of this additional beam at the focal plane typically has a ring shape, depleting the population of molecules that can generate fluorescence, especially near the edge of the focal spot. The depletion efficiency can be described by the red pattern shown in the third layer. This depletion effect substantially reduces the size of the fluorescent spot (orange, bottom layer), thereby improving the image resolution. (B) Structured illumination microscopy (SIM) and saturated SIM (SSIM) use pattered illumination to excite the sample and generate fluorescence. This patterned excitation typically has a sinusoidal shape (green, top layer). Such illumination generates a similarly shaped fluorescence emission pattern when the fluorescence responds in a linear manner (orange, middle layer). With strong excitation, fluorescence saturates, generating a saturated emission profile with narrow dark regions (orange, bottom layer) that provide spatial information substantially beyond the diffraction limit. (C) Examples of STED images. (Top) Comparison between confocal (left) and STED (right) images of the outer membrane of mitochondria that is immunolabeled against the protein TOM20. Shown in the STED panel is an xy cross section of the 3D isoSTED image. (Bottom-left) Two-color isoSTED image of TOM20 (green) and the matrix protein HSP70 (red). (Bottom-right) Three-dimensional rendering of an isoSTED image of TOM20. Reprinted by permission from Macmillan Publishers Ltd: Nature Methods Schmidt et al., 2008. Reprinted with permission from Schmidt et al., 2009, American Chemical Society. (D) Examples of 3D SIM images. (Top) Central cross-section of a confocal image of the nucleus stained for DNA, lamin B, and the nuclear pore complex. DNA (blue) is stained with DAPI. Lamin B (green) and the nuclear pore complex (red) are immunostained. The right panels show the magnified images of the boxed region in the left panel. (Bottom) Corresponding 3D SIM images. From Schermelleh et al., 2008. Reprinted with the permission from AAAS.
Figure 3
Figure 3
Super-Resolution Fluorescence Microscopy by Single-Molecule Switching (A) This super-resolution approach takes advantage of photoswitching of fluorophores to temporally separate images of single molecules that overlap spatially. At any time during image acquisition, only a sparse subset of fluorophores is activated to the fluorescence state, allowing these molecules to be imaged individually and thus localized. After multiple iterations of the activation and imaging processes, a super-resolution image is constructed from the localizations of many fluorophores. (B) 3D images taken using an astigmatism approach with cylindrical lens. (Two far-left columns) Conventional image of clathrin-coated pits in a mammalian cell immunostained against clathrin, in comparison with the corresponding 3D super-resolution image showing an xy cross section near the plasma membrane. (Middle) Magnified super-resolution images of a single clathrin-coated pit in a cell-free reconstitution system with an xy projection (top), an xy cross-section at the lower portion of the pit (middle), and an xz cross section cutting through the middle of the pit (bottom). (Two far-right columns) Composite 3D image of clathrin (green), dynamin (cyan), and an F-BAR domain protein FBP17 (red) in the cell-free system. Shown here is the super-position of 59 images of clathrin and FBP17 aligned to the center of the clathrin-coated regions (left) and the super-position of 96 dynamin-FBP17 images aligned to the center of dynamin spot (right). Clathrin is directly labeled, whereas dynamin and FBP17 are immunolabeled. From Huang et al., 2008 and Wu et al., 2010. Reprinted with the permission from AAAS. (C) Three-dimensional images taken using an interferometry approach with apposing objectives. (Top) xy projection of the plasma membrane of a cell expressing photoactivatable Eos-fluorescent protein. The color of the localization points encodes their z coordinates. (Bottom) xz cross-section of the boxed region in the top panel. Images adapted from Shtengel et al., 2009. (D) Comparison of STORM/(F)PALM images of clathrin-coated pits immunostained with the photoswitchable Alexa647 dye (green) or tagged with the mEos2 fluorescent protein (red).

References

    1. Abbe E. Beitrage zur Theorie des Mikroskops und der mikroskopischen Wahrnehmung. Arch. Mikroskop Anat. 1873;9:413–420.
    1. Bates M, Huang B, Dempsey GT, Zhuang X. Multicolor super-resolution imaging with photo-switchable fluorescent probes. Science. 2007;317:1749–1753. - PMC - PubMed
    1. Betzig E, Lewis A, Harootunian A, Isaacson M, Kratschmer E. Near-field scanning optical microscopy (NSOM) - Development and biophysical applications. Biophys. J. 1986;49:269–279. - PMC - PubMed
    1. Betzig E, Patterson GH, Sougrat R, Lindwasser OW, Olenych S, Bonifacino JS, Davidson MW, Lippincott-Schwartz J, Hess HF. Imaging intracellular fluorescent proteins at nanometer resolution. Science. 2006;313:1642–1645. - PubMed
    1. Biteen JS, Thompson MA, Tselentis NK, Bowman GR, Shapiro L, Moerner WE. Super-resolution imaging in live Caulobacter crescentus cells using photoswitchable EYFP. Nat. Methods. 2008;5:947–949. - PMC - PubMed

Publication types

MeSH terms