

Effect of the Arizona tobacco control program on cigarette consumption and healthcare expenditures
- PMID: 21168248
- PMCID: PMC3603372
- DOI: 10.1016/j.socscimed.2010.11.015
Effect of the Arizona tobacco control program on cigarette consumption and healthcare expenditures
Abstract
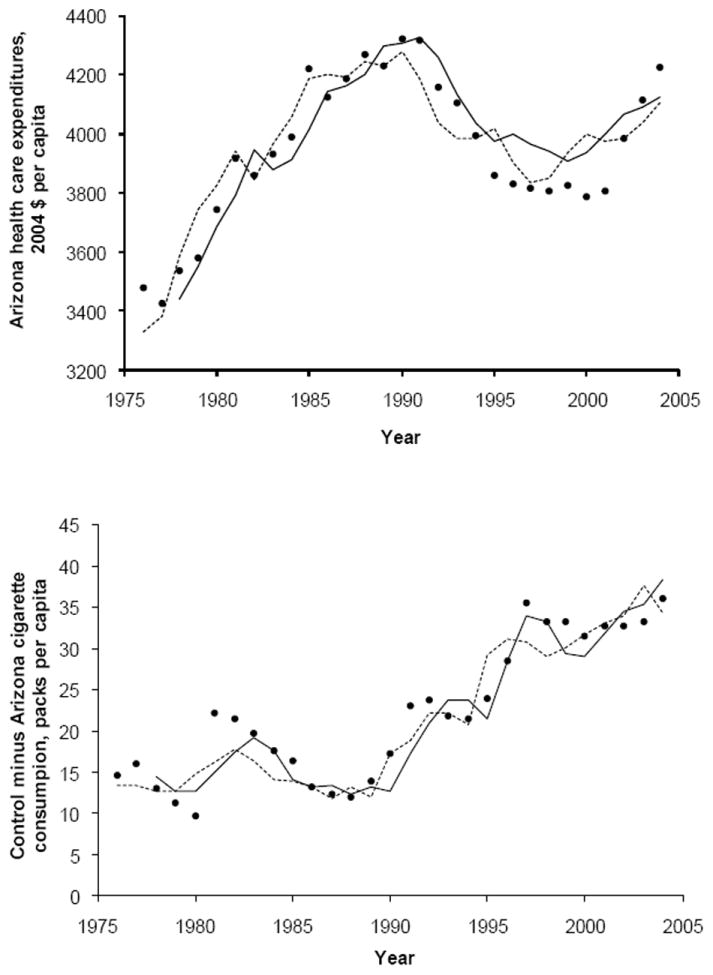
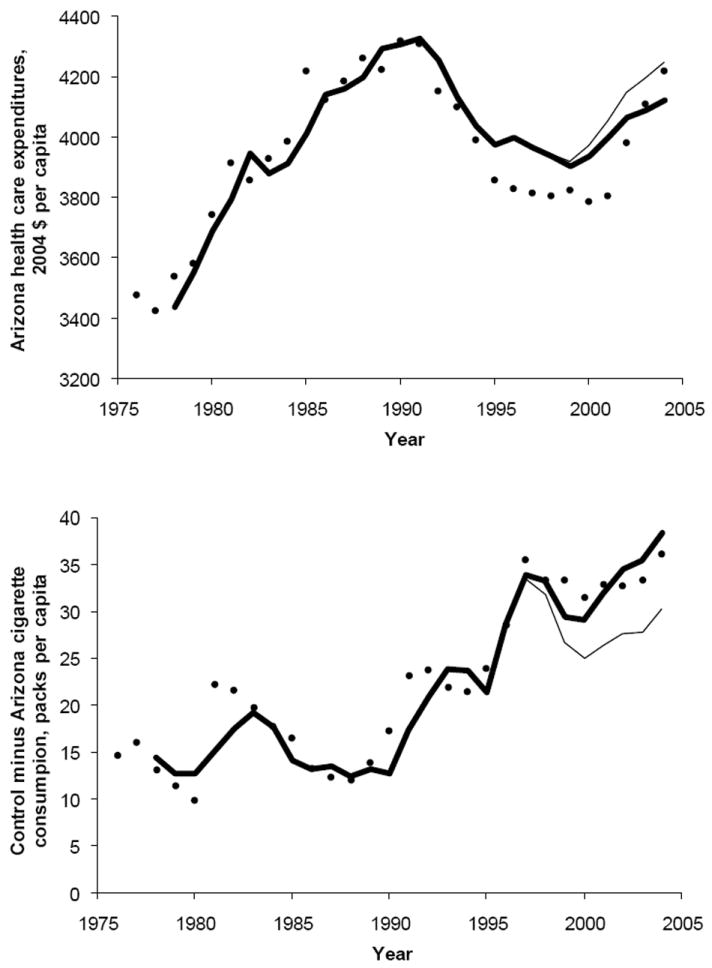
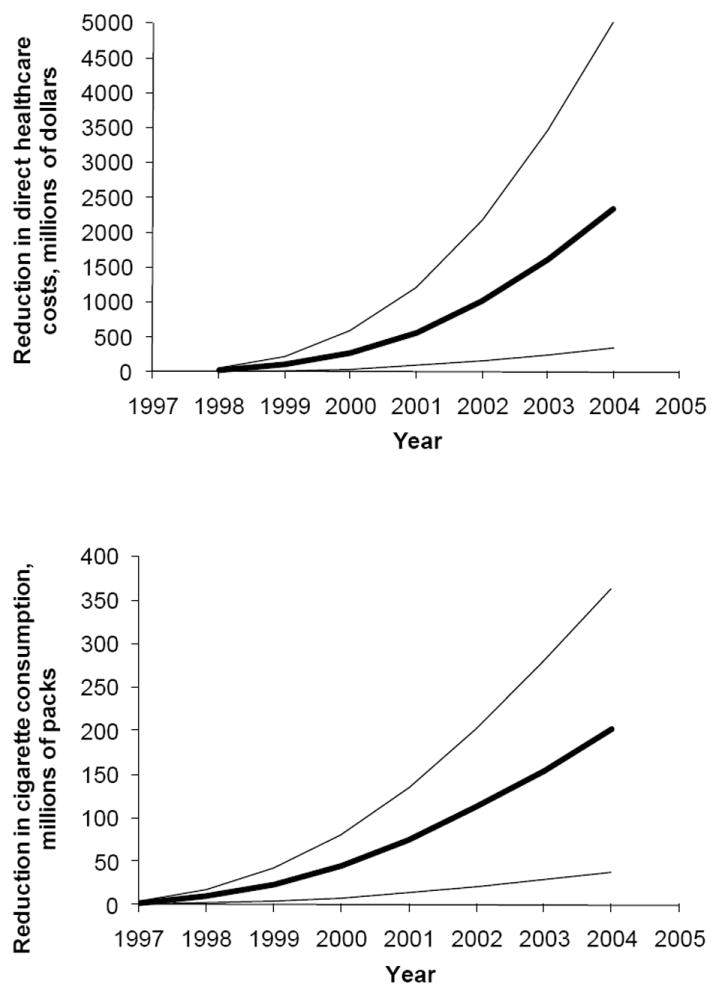
This research investigates the relationship between per capita tobacco control expenditures, cigarette consumption, and healthcare expenditures in the state of Arizona. Arizona's tobacco control program, which was established in 1994, concentrates on youth uptake of smoking and avoids public policy and commentary on the tobacco industry. We use a cointegrating time series analysis using aggregate data on healthcare and tobacco control expenditures, cigarette consumption and prices and other data. We find there is a strong association between per capita healthcare expenditure and per capita cigarette consumption. In the long run, a marginal increase in annual cigarette consumption of one pack per capita increases per capita healthcare expenditure by $19.5 (SE $5.45) in Arizona. A cumulative increase of $1.00 in the difference between control state and Arizona per capita tobacco control expenditures increases the difference in cigarette consumption by 0.190 (SE 0.0780) packs per capita. Between 1996 and 2004, Arizona's tobacco control program was associated with a cumulative reduction in cigarette consumption of 200 million packs (95% CI 39.0 million packs, 364 million packs) worth $500 million (95% CI: $99 million, $896 million) in pre-tax cigarette sales to the tobacco industry. The cumulative healthcare savings was $2.33 billion (95% CI $0.37 billion, $5.00 billion) and the cumulative reduction in cigarette. Arizona's tobacco control expenditures are associated with reduced cigarette consumption and healthcare expenditures, amounting to about 10 times the cost of the program through 2004. This return on investment, while large, was less than the more aggressive California program, which did not limit its focus to youth and included tobacco industry denomalization messages.
Copyright © 2010 Elsevier Ltd. All rights reserved.
Figures
References
-
- Abadie A, Diamond A, et al. NBER Working Paper Series. w12831. National Bureau of Economic Research; 2007. Synthetic control methods for comparative case studies: Estimating the effect of California’s Tobacco Control Program.
-
- Barnoya J, Glantz S. Association of the California tobacco control program with declines in lung cancer incidence. Cancer Causes Control. 2004;15(7):689–95. - PubMed
-
- Bialous SA, Glantz S. A Tobacco Control Policy Making: United States: Tobacco Control in Arizona, 1973-1997. 1997 Paper AZ1997. Retrieved Jan 2, 2008, from http://repositories.cdlib.org/ctcre/tcpmus/AZ1997.
-
- Bureau of Economic Analysis. State Annual Personal Income. 2007 Retrieved December 7, 2007, from http://bea.gov/regional/spi/default.cfm?satable=summary.
Publication types
MeSH terms
Grants and funding
LinkOut - more resources
Full Text Sources
