. 2011 Aug;55(2):278-88.
doi: 10.1016/j.jhep.2010.11.030. Epub 2010 Dec 17.

Reduced frequencies of NKp30+NKp46+, CD161+, and NKG2D+ NK cells in acute HCV infection may predict viral clearance

Affiliations

Reduced frequencies of NKp30+NKp46+, CD161+, and NKG2D+ NK cells in acute HCV infection may predict viral clearance

Galit Alter et al. J Hepatol. 2011 Aug.

Abstract

Background & aims: While the majority of HCV-infected patients progress to chronic hepatitis, a small fraction of individuals are able to clear the virus. Resolution of infection occurs within the first few weeks to months of infection, suggesting that innate immune functions may be critical for early control. Epidemiologic data support a role for particular NK cell receptor bearing populations in this control, yet the mechanism by which NK cells respond to HCV early in infection is unknown.

Methods: Changes in the phenotype and function of NK cells were investigated in a cohort of 43 individuals identified during various stages of HCV infection with different clinical outcomes.

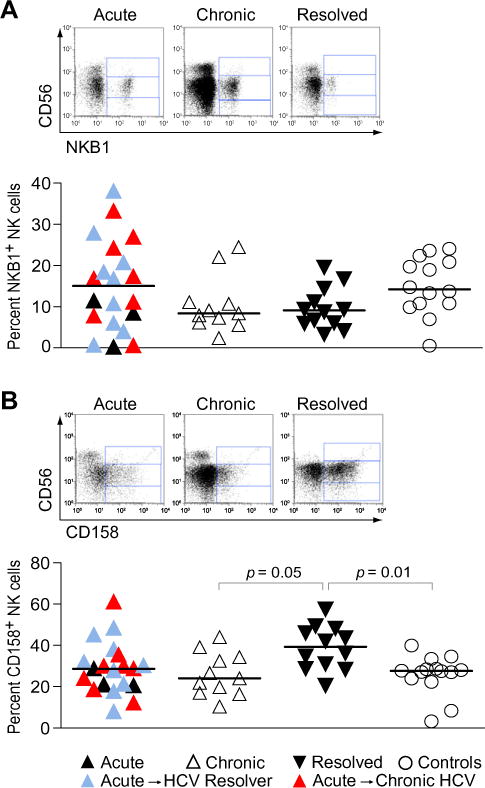
Results: Acute, chronic, and resolved HCV infections were characterized by an expansion of CD56(neg) NK cells. Furthermore, increased levels of HLA-C-binding KIR(+) NK cells were observed in HCV resolvers, while all stages of HCV infection were associated with reduced percentages of NKG2D(+), NKp30(+), and NKp46(+) NK cells, and a slight increase in the ability of NK cells to respond to target cells bearing the ligands for these receptors. In contrast, NKG2A(+) and CD94(+) NK cells were elevated in acute and chronic HCV infection, but not in resolved infection. Most importantly, in acute infection, lower frequencies of NKp30(+), NKp46(+), CD161(+), and NKG2D(+) NK cells were observed in patients who were subsequently able to clear HCV infection than in those becoming chronically infected.

Conclusions: These data implicate particular populations of NK cells in the early control and clearance of HCV infection.


Conflict of interest statement

Conflict of interest

The authors who have taken part in this study declared that they do not have anything to disclose regarding funding or conflict of interest with respect to this manuscript.

Figures

Fig. 1
Fig. 1. NK cell subset distribution in acute, chronic, and resolved HCV infection
The dot plots represent the percentages of total NK cells (A) or the proportions of CD56bright (CD3CD56+ CD16), CD56dim (CD3CD56+ CD16+) and CD56neg (CD3CD56CD16+) NK cells (B) from 13 patients with acute, 11 patients with chronic and 12 individuals with resolved HCV infection and 14 HCV-negative subjects. (▲, Acute HCV; red N, acute HCV with subsequent progression to chronic infection; blue ▲, acute HCV with subsequent resolution of infection; △, chronic HCV; ▼, HCV resolvers; and ○, HCV-negative controls). Horizontal lines indicate the median percentages. p values < 0.05 after adjustment for multiple comparisons are indicated. (For interpretation of the references to color in this figure legend, the reader is referred to the web version of this paper.)
Fig. 2
Fig. 2. Increased proportions of HLA-C binding KIR+ (CD158+) NK cells in resolvers
The dot plots show the overall amounts of (A) HLA-B and (B) HLA-C binding KIR+ NK cells using the NKB1 (KIR3DL1) and the CD158a and CD158b (KIR2DL1/2DS1 and KIR2DL2/2DL3/2DS2) antibodies, in patients with acute (▲), chronic (△) and resolved (▼) HCV infection compared to uninfected controls. Red ▲, acute HCV with subsequent progression to chronic infection; blue ▲, acute HCV with subsequent resolution of infection. Horizontal lines indicate the median percentages. p values < 0.05 after adjustment for multiple comparisons are indicated. Representative primary flow panels show percentages of HLA-B (A) and HLA-C (B) binding KIR+ CD56bright, CD56dim, and CD56neg NK cells for an acute, a chronic and a resolved HCV infection. (For interpretation of the references to color in this figure legend, the reader is referred to the web version of this paper.)
Fig. 3
Fig. 3. Changes in C-type lectin expression at different stages of HCV infection
Each dot plot compares the overall amount of NK cells expressing relevant NKG2 family members including the inhibitory heterodimer NKG2A/CD94 and the activating NKG2D receptors in HCV-negative (○) individuals with that of patients with acute (▲), chronic (△) and resolved (▼) HCV infection. Red ▲, acute HCV with subsequent progression to chronic infection; blue ▲, acute HCV with subsequent resolution of infection. Horizontal lines indicate the median percentages. p values < 0.05 after adjustment for multiple comparisons are indicated. (For interpretation of the references to color in this figure legend, the reader is referred to the web version of this paper.)
Fig. 4
Fig. 4. HCV infection is associated with a loss of NK cells expressing NKp46 and NKp30
Each dot plot compares the overall amount of NK cells expressing NKp30, NKp46, and NKp44 in HCV-negative individuals (○) with that of patients with acute (▲), chronic (△), and resolved (▼) HCV infection. Red ▲, acute HCV with subsequent progression to chronic infection; blue ▲, acute HCV with subsequent resolution of infection. Horizontal lines indicate the median percentages. p values < 0.05 after adjustment for multiple comparisons are indicated. Representative primary flow panels show percentages of NKp46+ and NKp30+ CD56bright, CD56dim, and CD56neg NK cells for an acute, a chronic, and a resolved HCV infection. (For interpretation of the references to color in this figure legend, the reader is referred to the web version of this paper.)
Fig. 5
Fig. 5. Resolution of HCV infection can be predicted by decreased proportions of NKp46+ NKp30+ and CD161+ NK cells at the time of acute infection
The dot plots compare the proportions of NK cells expressing the indicated surface receptors (A) or both NKp30 and NKp46 (B) between study subjects identified during acute HCV infection who subsequently developed a chronic disease (■) and subjects who subsequently resolved the infection (■). Horizontal lines indicate the median percentages. Differences where p < 0.05 are indicated. (C) Representative primary flow panels show percentages of CD161+ CD56bright, CD161+ CD56dim and CD161+ CD56neg NK cells for an HCV acute infection which subsequently became chronic, an HCV acute infection which was subsequently cleared, a chronic, and a resolved HCV infection.
Fig. 6
Fig. 6. The response to K562 MHC-I-devoid target cells is increased in patients with acute HCV infection
(A) Dot plots represent the percent of NK cells that produced CD107a following a 6 h incubation with 221 cells, K562 cells and p815 cells covered with p815 antibody at an E:T ratio of 10:1 for each individual divided among. ▲, acute HCV; △, chronic HCV; ▼, HCV resolvers; and ○, HCV negative controls. Horizontal lines indicate the median percentages. Representative primary flow panels show percentages of CD107a+ CD56bright, CD107a+ CD56dim and CD107a+ CD56negNK cells in response to 221, K562, and p815-coated target cells. (B) The functional capacity of NK cells against K562 target cells correlates with the proportion of NK cells expressing NKG2D. (C) The dot plots compare the proportions of CD107a+ NK cells between study subjects identified during acute HCV infection who subsequently developed a chronic disease (■) and subjects who subsequently resolved the infection (■). Horizontal lines indicate the median percentages. (D) Inverse correlation between the intensity of the NK cell response against 221 target cells and the proportion of NK cells expressing NKp46. (E)The ability of NK cells to perform ADCC positively correlates with the proportion of NK cells expressing theFcγRCD16. (F) and (G) The dot plots compare the percentages of CD56bright, CD56dim, and CD56neg NK cells that produced IFN-γ (F) or CD107a (G) following a 6 h incubation with 221, K562, and p815 cells covered with p815 antibody at an E:T ratio of 10:1 for each individual divided among. ▲, Acute HCV; △, chronic HCV; ▼, HCV resolvers; and ○, HCV negative controls. Horizontal lines indicate the median percentages. Representative primary flow panels show percentages of IFN-γ + CD56bright, IFN-γ + CD56dim, and IFN-γ + CD56neg NK cells in response to 221, K562 and p815-coated target cells.
Fig. 7
Fig. 7. NCRs downregulation occurs following both direct and indirect-NCR activation of NK cells
The whisker box plots depict changes in both NKp46 (A and B) and NKp30 (C and D) expression on NK cells following direct stimulation with the NCR-ligand expressing cell line 221, or the non-NCR-ligand expressing cell line K562. (A and C) The percentages of NKp46+ and NKp30+ NK cells; (B and D) The mean fluorescence intensity of each NCR on NK cells differences where p < 0.05 is indicated.

Comment in

  • NK cells in acute hepatitis C.
    Nattermann J. Nattermann J. J Hepatol. 2011 Aug;55(2):265-7. doi: 10.1016/j.jhep.2011.01.005. Epub 2011 Jan 12. J Hepatol. 2011. PMID: 21236311 No abstract available.

References

    1. WHO. Hepatitis C fact sheet.
    1. Shepard CW, Finelli L, Alter MJ. Global epidemiology of hepatitis C virus infection. Lancet Infect Dis. 2005;5:558–567. - PubMed
    1. Day CL, Lauer GM, Robbins GK, et al. Broad specificity of virus-specific CD4+ T-helper-cell responses in resolved hepatitis C virus infection. J Virol. 2002;76:12584–12595. - PMC - PubMed
    1. Lauer GM, Ouchi K, Chung RT, et al. Comprehensive analysis of CD8(+)-T-cell responses against hepatitis C virus reveals multiple unpredicted specificities. J Virol. 2002;76:6104–6113. - PMC - PubMed
    1. Grakoui A, Shoukry NH, Woollard DJ, et al. HCV persistence and immune evasion in the absence of memory T cell help. Science. 2003;302:659–662. - PubMed

MeSH terms

Substances