. 2011 Jul 15;57(2):303-11.
doi: 10.1016/j.neuroimage.2010.12.027. Epub 2010 Dec 17.

The dorsal medial frontal cortex is sensitive to time on task, not response conflict or error likelihood

Affiliations

The dorsal medial frontal cortex is sensitive to time on task, not response conflict or error likelihood

Jack Grinband et al. Neuroimage. .

Abstract

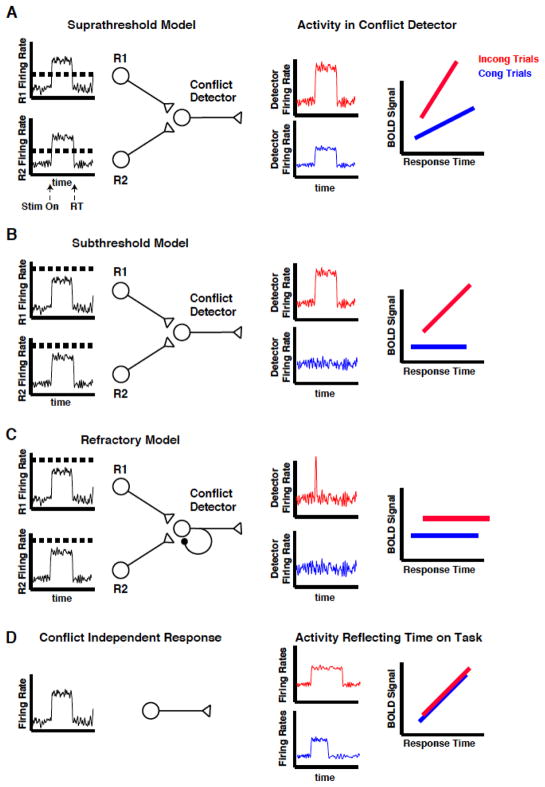
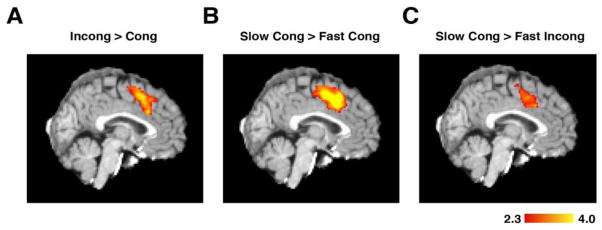
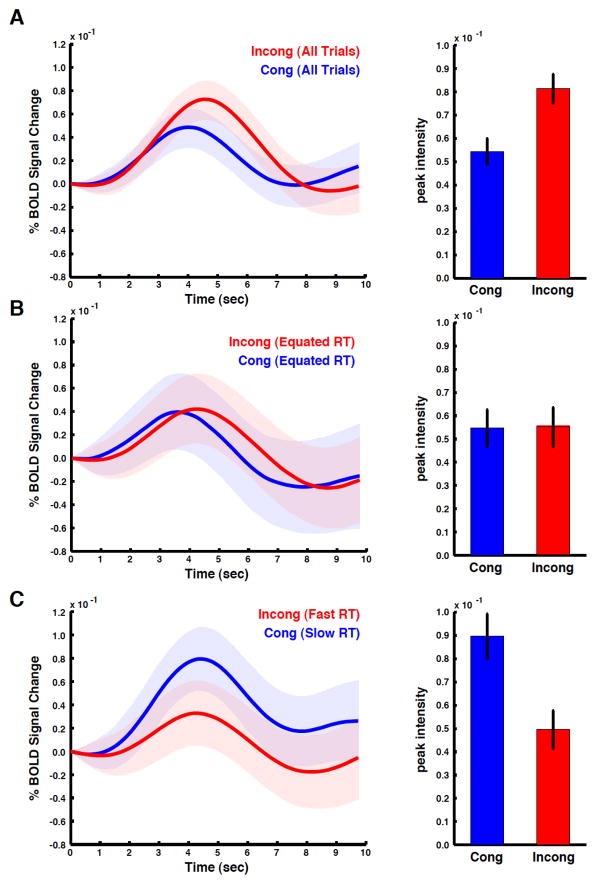
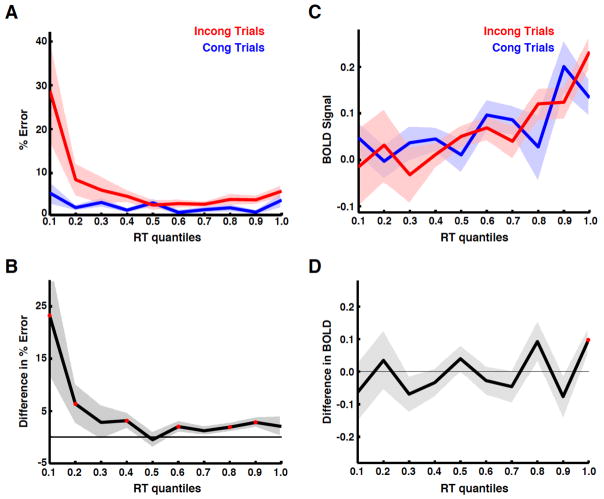
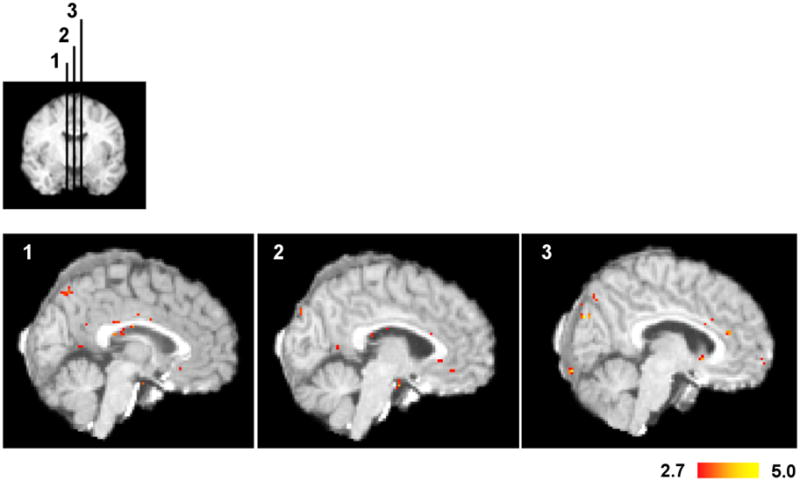
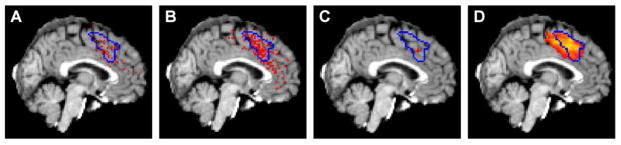
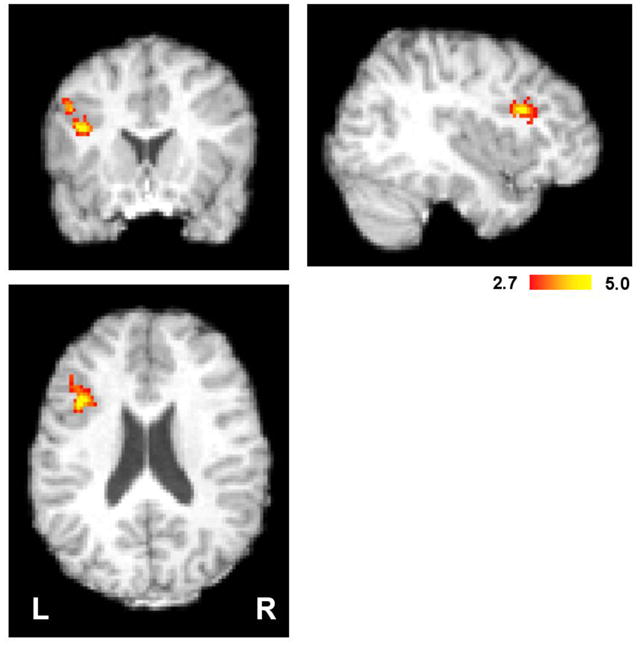
The dorsal medial frontal cortex (dMFC) is highly active during choice behavior. Though many models have been proposed to explain dMFC function, the conflict monitoring model is the most influential. It posits that dMFC is primarily involved in detecting interference between competing responses thus signaling the need for control. It accurately predicts increased neural activity and response time (RT) for incompatible (high-interference) vs. compatible (low-interference) decisions. However, it has been shown that neural activity can increase with time on task, even when no decisions are made. Thus, the greater dMFC activity on incompatible trials may stem from longer RTs rather than response conflict. This study shows that (1) the conflict monitoring model fails to predict the relationship between error likelihood and RT, and (2) the dMFC activity is not sensitive to congruency, error likelihood, or response conflict, but is monotonically related to time on task.


Figures

Figure 1
Figure 1. Model predictions
Both the conflict monitoring and time on task accounts predict larger mean BOLD activity on incongruent trials. (A) In the “suprathreshold” model, activity in the response neurons (R1 and R2) activate the detector when threshold (horizontal dashed line) is exceeded. Thus, conflict can be present on both congruent (blue) and incongruent (red) trials, and depends on the firing duration of the response neurons. Because the input per unit time to the detector is greater on incongruent than congruent trials, the BOLD vs. RT functions have different slopes. (B) In the “subthreshold” model, activity from a single response neuron is not sufficient to activate the detector. Thus, the BOLD signal does not vary with duration of the response neuron on congruent trials. Activity from both response neurons is necessary to exceed threshold and cause a conflict-related response, which varies with response duration. (C) In the “refractory” model, activity from both response neurons is necessary to reach the detector’s activation threshold. However, a refractory period created by autoinhibitory connections or inhibitory feedback from other neurons allows only a brief pulse of activity in the presence of conflict, resulting in activity that is independent of response duration (i.e. BOLD vs. RT functions with zero slope). (D) If activity in the MFC is determined only by time on task, then the BOLD vs. RT functions should be identical for congruent and incongruent trials.
Figure 2
Figure 2. Statistical parametric mapping
(A) Traditional GLM analysis comparing incongruent and congruent trials replicates previous results (Botvinick et al., 1999; Botvinick et al., 2001; Carter et al., 1998; Kerns et al., 2004) (peak activity = MNI152: 0/16/42). The activity was generated using only correct trials. (B) Congruent trials do not contain any incongruent features that could produce response interference. However, a comparison of slow versus fast congruent trials shows a pattern of activation in dMFC (MNI152: -4/16/40) that is similar to the “high conflict” pattern, indicating that dMFC activity is not specific to conflict. Fast and slow trials were defined as trials with RTs less than or greater than the median RT, respectively. (C) Slow congruent trials generate more activation than fast incongruent trials in dMFC (MNI152: -4/16/36), demonstrating that response time can better account for dMFC activation than the degree of response conflict. All activity is represented in Z-scores.
Figure 3
Figure 3. Event-related averages
BOLD data was extracted from voxels active in the incongruent > congruent comparison (all comparisons used Fig 2A as the region of interest). BOLD responses from correct trials were then averaged across subjects (shading represents standard error). (A) When all trials in the RT distribution are included in the analysis, average BOLD responses are larger for the incongruent condition. To quantify the differences between the two BOLD responses, the peak response for each subject was compared. Bar graphs show a significantly larger response for the incongruent than congruent condition, consistent with previous studies of conflict monitoring (error bars represent standard error across subjects). (B) To control for mean differences in RT between conditions, we compared only trials within 100 ms of each subject’s median RT. No differences between congruent and incongruent trials were detected. (C) A comparison of fast incongruent and slow congruent trials produced a reversal in the relative size of the BOLD responses, demonstrating that slower RTs produce greater dMFC activity independent of stimulus congruency.
Figure 4
Figure 4. Error likelihood and BOLD differences across RTs
(A) To determine the relationship between conflict and RT, the percent error across subjects was plotted for congruent and incongruent trials as a function of RT quantile. (B) The difference in error rates between the two conditions (i.e. incongruent – congruent trials) shows greater conflict on incongruent trials for most RT quantiles. Red points indicate quantiles for which a significant difference was present. (C) The mean BOLD response for correct trials was integrated over 10 s, averaged across subjects, and plotted as a function of RT quantile. The BOLD signal showed a systematic increase as a function of RT for both congruent and incongruent trials, consistent with the time on task account (Fig 1D), but contrary to the conflict monitoring model (Fig 1ABC). (D) The difference between the two BOLD responses was plotted for each RT quantile. Positive values indicate larger responses for incongruent trials; negatives values indicate larger responses for congruent trials. Resulting values were centered on zero, indicating that after controlling for RT, BOLD responses were not affected by conflict. This quantile analysis was repeated for two other masks defined using anatomical landmarks and functional imaging meta-analysis (Fig S4), and demonstrated similar results.
Figure 5
Figure 5. Voxel-wise comparison of congruent and incongruent trials controlling for RT
For each subject, the BOLD responses were averaged across quantiles within each condition. A one-sided, paired t-test was performed between congruent and incongruent trials across subjects. Voxel t-values were thresholded at p = 0.01. To determine if any region of the dMFC might be involved in conflict monitoring, we performed the analysis without correcting for multiple comparisons. Despite this extremely lenient threshold, we found no regions in the dMFC that were consistent with the conflict monitoring hypothesis. This lack of significant regions in dMFC is not due to insufficient statistical power, since sufficient power was present to detect activity in Broca’s area.
Figure 6
Figure 6. Comparison against previous studies
(A) The region of interest tested for conflict-related activity was defined using a functional contrast of correct incongruent minus correct congruent trials (Fig. 2A; blue outline). To determine how similar this activity was to that of previous studies, we overlaid peak activation from 48 studies using the Stroop task (Nee et al, 2007). Each point represents the peak activation from an incongruent minus congruent comparison. The majority of previous studies were consistent with our activation. (B) We repeated the analysis for 200 non-Stroop studies (Nee et al, 2007) that identified conflict-related activity. The majority was consistent with our activation. (C) The mean locations (red cross) of both the Stroop studies (mean MNI152: 2/21/40, std: 7/13/13) and the non-Stroop studies (mean MNI152: 2/21/40, std: 6/14/16) were consistent with our activation. (D) To determine which of the voxels that show greater activity for the incongruent trials are also monotonically related to RT, we performed a GLM analysis using a single epoch regressor in which the duration of each epoch was equal to RT for that trial. Furthermore, this regressor included all correct trials, that is, it did not differentiate between congruent and incongruent epochs. All voxels that showed greater activity in the incongruent minus congruent contrast also showed a significant relationship to RT.
Figure 7
Figure 7. Activity in left inferior frontal gyrus (BA44/45, including Broca’s area) correlates with increased conflict after controlling for RT
For each subject, the BOLD responses were averaged across quantiles within each condition. A one-sided, paired t-test was performed between congruent and incongruent trials across subjects. Greater activity in Broca’s area suggests increased competition between multiple linguistic representations of the stimulus on incongruent trials. Voxel t-values were thresholded at p = 0.01, clusters thresholded at p = 0.01 using Gaussian Random Field Theory. Peak activity was located at MNI152: -38/16/22.

Comment in

References

    1. Banich MT, Milham MP, Atchley R, Cohen NJ, Webb A, Wszalek T, Kramer AF, Liang ZP, Wright A, Shenker J, Magin R. fMri studies of Stroop tasks reveal unique roles of anterior and posterior brain systems in attentional selection. J Cogn Neurosci. 2000;12:988–1000. - PubMed
    1. Botvinick M, Nystrom LE, Fissell K, Carter CS, Cohen JD. Conflict monitoring versus selection-for-action in anterior cingulate cortex. Nature. 1999;402:179–181. - PubMed
    1. Botvinick MM, Braver TS, Barch DM, Carter CS, Cohen JD. Conflict monitoring and cognitive control. Psychol Rev. 2001;108:624–652. - PubMed
    1. Brown JW, Braver TS. Learned predictions of error likelihood in the anterior cingulate cortex. Science. 2005;307:1118–1121. - PubMed
    1. Bush G, Vogt BA, Holmes J, Dale AM, Greve D, Jenike MA, Rosen BR. Dorsal anterior cingulate cortex: a role in reward-based decision making. Proc Natl Acad Sci U S A. 2002;99:523–528. - PMC - PubMed

Publication types

LinkOut - more resources