

DNA methylation patterns in luminal breast cancers differ from non-luminal subtypes and can identify relapse risk independent of other clinical variables
- PMID: 21169070
- PMCID: PMC5528275
- DOI: 10.1016/j.molonc.2010.11.002
DNA methylation patterns in luminal breast cancers differ from non-luminal subtypes and can identify relapse risk independent of other clinical variables
Abstract
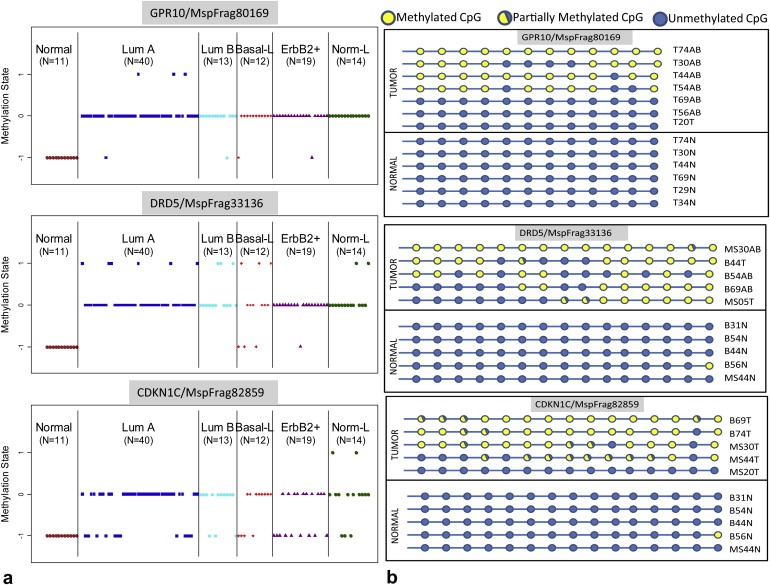
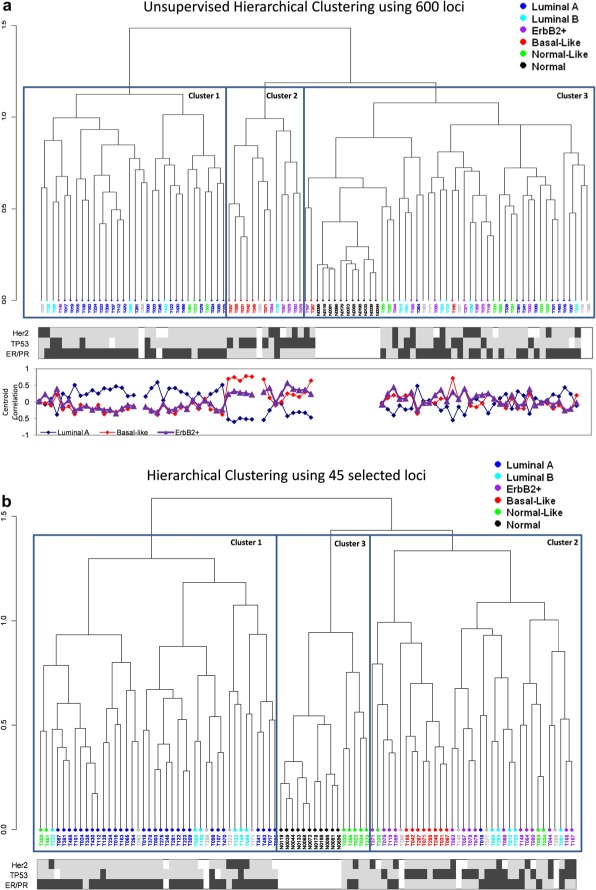
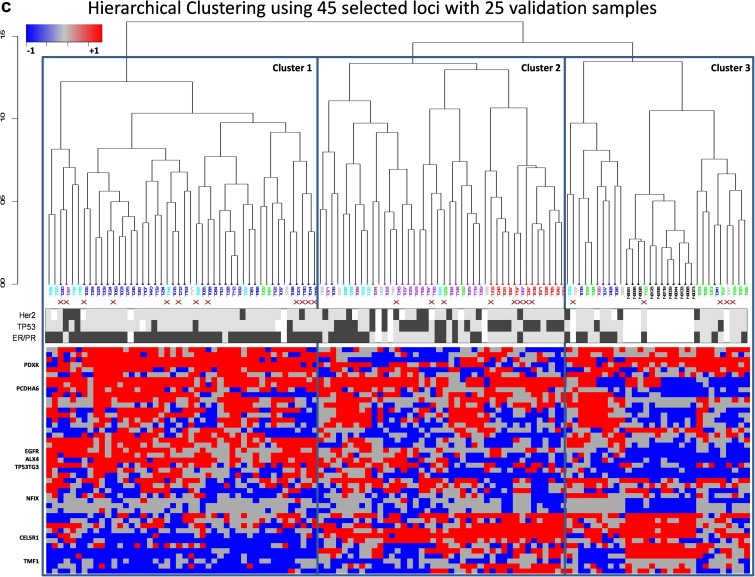
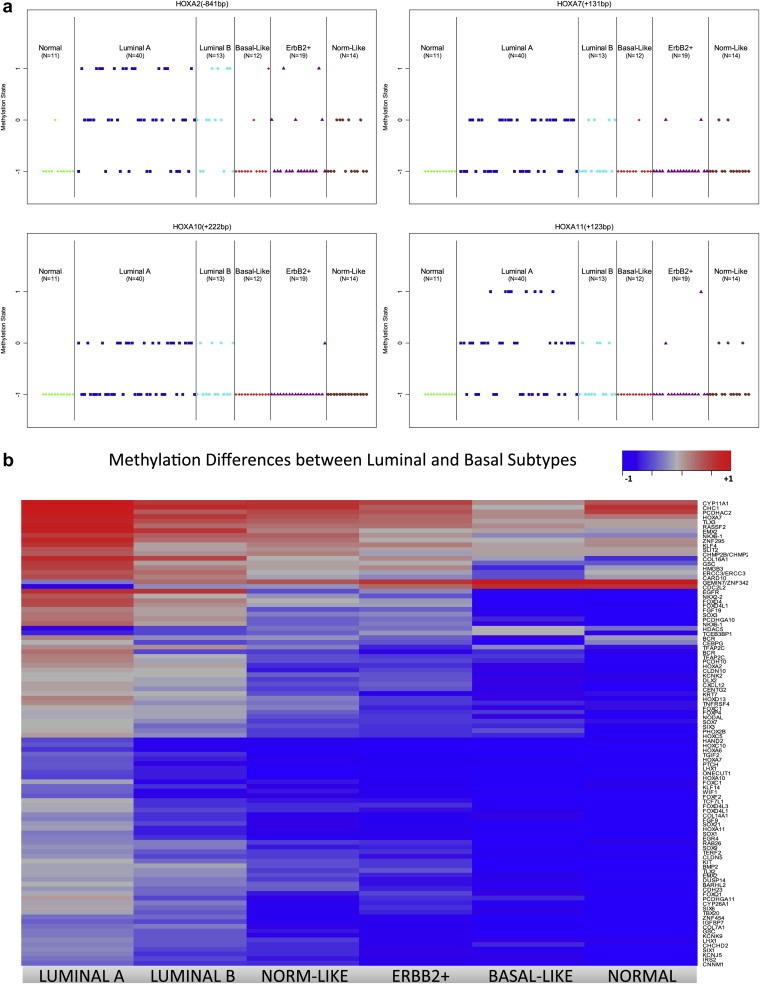
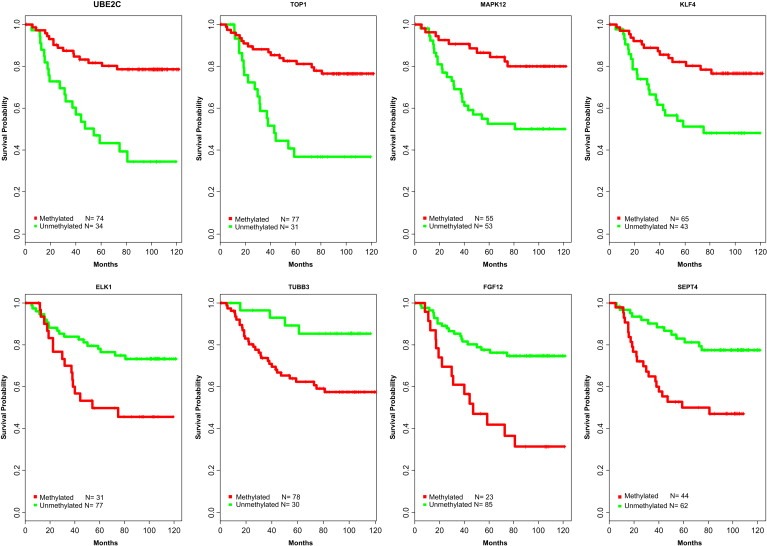
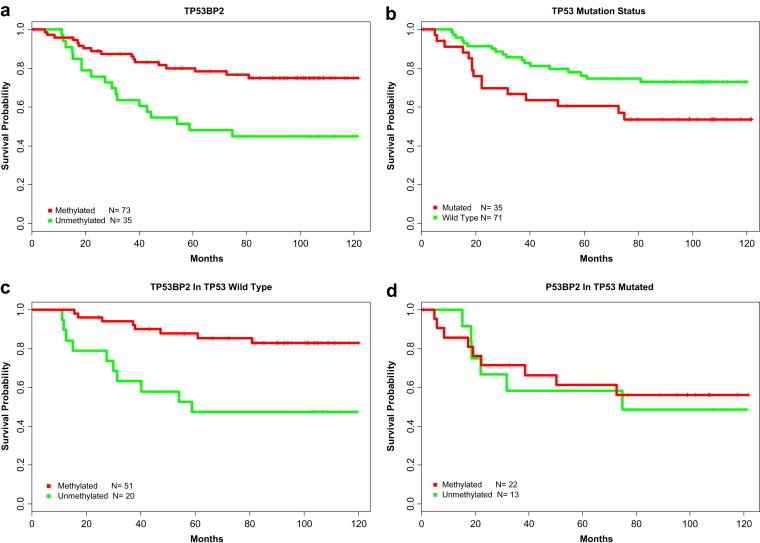
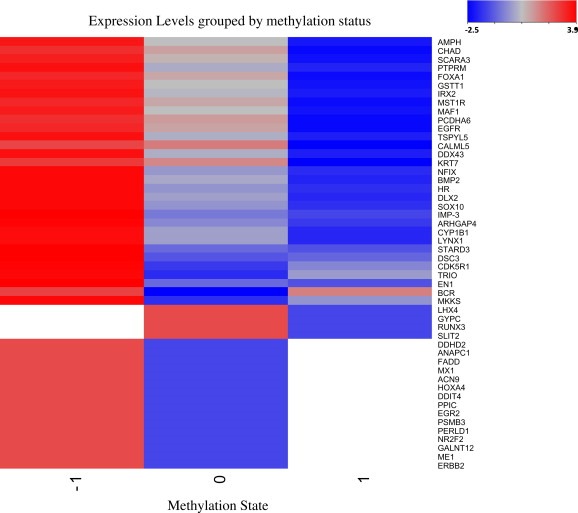
The diversity of breast cancers reflects variations in underlying biology and affects the clinical implications for patients. Gene expression studies have identified five major subtypes- Luminal A, Luminal B, basal-like, ErbB2+ and Normal-Like. We set out to determine the role of DNA methylation in subtypes by performing genome-wide scans of CpG methylation in breast cancer samples with known expression-based subtypes. Unsupervised hierarchical clustering using a set of most varying loci clustered the tumors into a Luminal A majority (82%) cluster, Basal-like/ErbB2+ majority (86%) cluster and a non-specific cluster with samples that were also inconclusive in their expression-based subtype correlations. Contributing methylation loci were both gene associated loci (30%) and non-gene associated (70%), suggesting subtype dependant genome-wide alterations in the methylation landscape. The methylation patterns of significant differentially methylated genes in luminal A tumors are similar to those identified in CD24 + luminal epithelial cells and the patterns in basal-like tumors similar to CD44 + breast progenitor cells. CpG islands in the HOXA cluster and other homeobox (IRX2, DLX2, NKX2-2) genes were significantly more methylated in Luminal A tumors. A significant number of genes (2853, p < 0.05) exhibited expression-methylation correlation, implying possible functional effects of methylation on gene expression. Furthermore, analysis of these tumors by using follow-up survival data identified differential methylation of islands proximal to genes involved in Cell Cycle and Proliferation (Ki-67, UBE2C, KIF2C, HDAC4), angiogenesis (VEGF, BTG1, KLF5), cell fate commitment (SPRY1, OLIG2, LHX2 and LHX5) as having prognostic value independent of subtypes and other clinical factors.
Copyright © 2010 Federation of European Biochemical Societies. Published by Elsevier B.V. All rights reserved.
Figures
References
-
- Beissbarth, T. , Speed, T.P. , 2004. GOstat: find statistically overrepresented Gene Ontologies within a group of genes. Bioinformatics. 20, (9) 1464–1465. - PubMed
-
- Bergamaschi, A. , Kim, Y.H. , 2006. Distinct patterns of DNA copy number alteration are associated with different clinicopathological features and gene-expression subtypes of breast cancer. Genes Chromosomes Cancer. 45, (11) 1033–1040. - PubMed
MeSH terms
LinkOut - more resources
Full Text Sources
Other Literature Sources
Medical
Research Materials
Miscellaneous
