

Why is the subendocardium more vulnerable to ischemia? A new paradigm
- PMID: 21169398
- PMCID: PMC3064294
- DOI: 10.1152/ajpheart.00473.2010
Why is the subendocardium more vulnerable to ischemia? A new paradigm
Abstract
Myocardial ischemia is transmurally heterogeneous where the subendocardium is at higher risk. Stenosis induces reduced perfusion pressure, blood flow redistribution away from the subendocardium, and consequent subendocardial vulnerability. We propose that the flow redistribution stems from the higher compliance of the subendocardial vasculature. This new paradigm was tested using network flow simulation based on measured coronary anatomy, vessel flow and mechanics, and myocardium-vessel interactions. Flow redistribution was quantified by the relative change in the subendocardial-to-subepicardial perfusion ratio under a 60-mmHg perfusion pressure reduction. Myocardial contraction was found to induce the following: 1) more compressive loading and subsequent lower transvascular pressure in deeper vessels, 2) consequent higher compliance of the subendocardial vasculature, and 3) substantial flow redistribution, i.e., a 20% drop in the subendocardial-to-subepicardial flow ratio under the prescribed reduction in perfusion pressure. This flow redistribution was found to occur primarily because the vessel compliance is nonlinear (pressure dependent). The observed thinner subendocardial vessel walls were predicted to induce a higher compliance of the subendocardial vasculature and greater flow redistribution. Subendocardial perfusion was predicted to improve with a reduction of either heart rate or left ventricular pressure under low perfusion pressure. In conclusion, subendocardial vulnerability to a acute reduction in perfusion pressure stems primarily from differences in vascular compliance induced by transmural differences in both extravascular loading and vessel wall thickness. Subendocardial ischemia can be improved by a reduction of heart rate and left ventricular pressure.
Figures
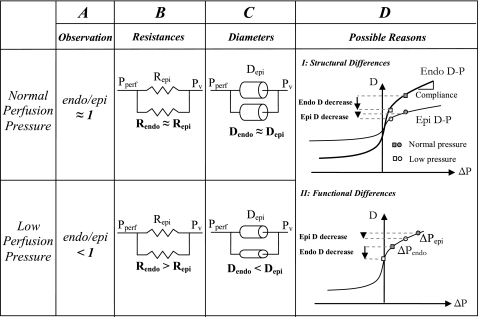
 ), when combined with vascular nonlinear D-P, result in higher subendocardial compliance and a consequent larger diameter reduction in subendocardial vessels, as long as the pressures are within the concave (high) range of the D-P curve.

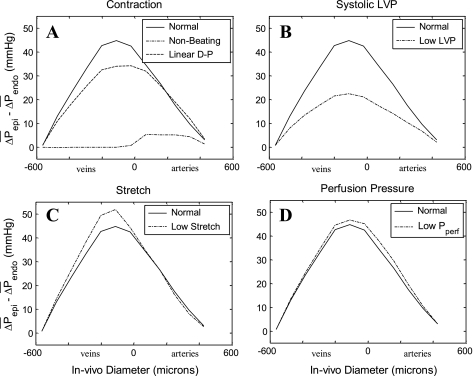 (epi − endo). A: predicted effects of myocardial contraction and of the vessel pressure-dependent (vs. constant) compliance. With contraction, levels of vessels that perfuse the subepicardium or drain it are substantially higher than the levels of the respective subendocardial vessels, whether vessel compliance is pressure dependent (solid line) or constant (dashed line). Without contraction (dashed-dotted line), the ΔP difference is considerably lower. B: predicted effects of systolic LVP. Low levels (60 mmHg, dashed-dotted line) are predicted to substantially decrease the ΔP difference compared with normal (120 mmHg, solid line) levels. C: predicted effects of vessel compliance. High compliance (dashed-dotted line), induced by a low level (1.0) of in situ stretch (see Fig. 3C), increases the predicted ΔP difference compared with normal (1.2, solid line) in situ stretch, although the effect is predicted to be lower compared with that of systolic LVP. D: predicted effects of a Pperf reduction. Lower Pperf levels (35 mmHg, dashed-dotted line) are predicted to moderately increase the ΔP difference compared with normal (95 mmHg; solid line) Pperf. x-Axis, vessel time-averaged diameter (in μm; veins on the left of 0 and arteries on the right of 0); y-axis, difference between values of the subepicardial vessels and respective subendocardial vessels (in mmHg).

 in each vessel as predicted by the flow analysis. Diameters were determined from the corresponding D-P curves in the subendocardium (solid line) and subepicardium (dashed line). Under baseline conditions (squares; Table 1), both subendocardial and subepicardial vessel diameters are 0.1 mm. Under high contractility (change of scale factor α in Eq. 2 from 140 to 280 mmHg/% shortening; diamonds), the vessel diameter decreases (compared with baseline; arrowheads) more prominently in the subendocardium than in the subepicardium due to the higher slope (i.e., compliance) of subendocardial D-P curve. Similar diameter changes occur under reduced Pperf (from 95 to 75 mmHg; circles). x-Axis, ΔP (in mmHg); y-axis, vessel diameter (in mm). B: predicted diameters in representative subendocardial and subepicardial venules. In the venules, high contractility reduces the predicted ΔP in both subepicardial and subendocardial veins. Subepicardial diameters decrease accordingly, whereas subendocardial diameters are hardly affected by the contractility-induced pressure change, due to the low slope of the D-P curve. In contrast, reduced Pperf hardly changes the predicted pressures and diameters since their ΔP is little affected by Pperf. C: longitudinal distribution of the transmural difference in diameter changes. The predicted decrease in arterial diameters due to contractility elevation (CTR; dashed line) is up to 5% higher in the subendocardium than in the subepicardium, whereas the reduction in subepicardial venous diameters is up to 10% higher than in subendocardial venous diameters. In contrast, after a Pperf reduction (solid line), the reduction in subepicardial venous diameters is only mildly lower than in subendocardial venous diameters. x-Axis, vessel time-averaged diameter (in μm; veins on the left of 0 and arteries on the right of 0); y-axis, difference between the predicted diameter change in vessels feeding the endocardium and epicardium (EndoD change − EpiD change).
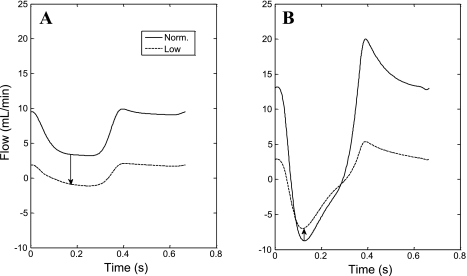
References
-
- Bache RJ, Schwartz JS. Effect of perfusion pressure distal to a coronary stenosis on transmural myocardial blood flow. Circulation 65: 928–935, 1982 - PubMed
-
- Boatwright RB, Downey HF, Bashour FA, Crystal GJ. Transmural variation in autoregulation of coronary blood flow in hyperperfused canine myocardium. Circ Res 47: 599–609, 1980 - PubMed
-
- Bruinsma P, Arts T, Dankelman J, Spaan JA. Model of the coronary circulation based on pressure dependence of coronary resistance and compliance. Basic Res Cardiol 83: 510–524, 1988 - PubMed
-
- Buckberg GD, Fixler DE, Archie JP, Hoffman JI. Experimental subendocardial ischemia in dogs with normal coronary arteries. Circ Res 30: 67–81, 1972 - PubMed
Publication types
MeSH terms
Grants and funding
LinkOut - more resources
Full Text Sources