. 2011 Feb;10(2):198-206.
doi: 10.1128/EC.00216-10. Epub 2010 Dec 17.

Systematic screen of Schizosaccharomyces pombe deletion collection uncovers parallel evolution of the phosphate signal transduction pathway in yeasts

Affiliations

Systematic screen of Schizosaccharomyces pombe deletion collection uncovers parallel evolution of the phosphate signal transduction pathway in yeasts

Theresa C Henry et al. Eukaryot Cell. 2011 Feb.

Abstract

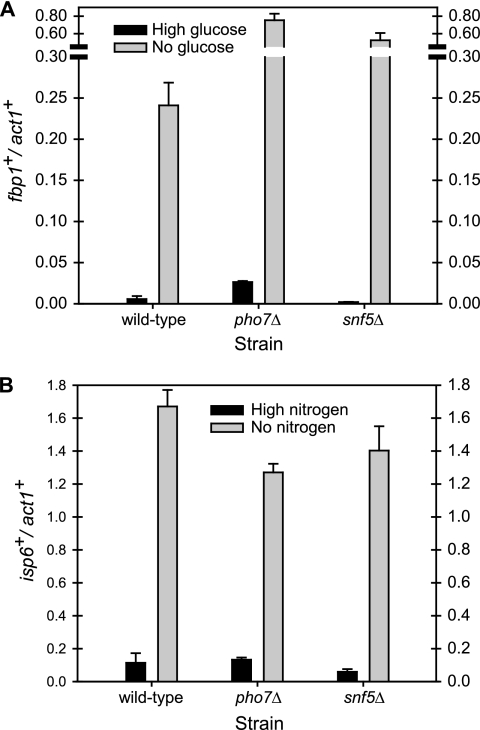
The phosphate signal transduction (PHO) pathway, which regulates genes in response to phosphate starvation, is well defined in Saccharomyces cerevisiae. We asked whether the PHO pathway was the same in the distantly related fission yeast Schizosaccharomyces pombe. We screened a deletion collection for mutants aberrant in phosphatase activity, which is primarily a consequence of pho1(+) transcription. We identified a novel zinc finger-containing protein (encoded by spbc27b12.11c(+)), which we have named pho7(+), that is essential for pho1(+) transcriptional induction during phosphate starvation. Few of the S. cerevisiae genes involved in the PHO pathway appear to be involved in the regulation of the phosphate starvation response in S. pombe. Only the most upstream genes in the PHO pathway in S. cerevisiae (ADO1, DDP1, and PPN1) share a similar role in both yeasts. Because ADO1 and DDP1 regulate ATP and IP(7) levels, we hypothesize that the ancestor of these yeasts must have sensed similar metabolites in response to phosphate starvation but have evolved distinct mechanisms in parallel to sense these metabolites and induce phosphate starvation genes.


Figures

Fig. 1.
Fig. 1.
Colorimetric plate phosphatase assays. (A) DP4 and DP3 are wild-type strains; DP55 is a pho1Δ strain, and TH4 is a constitutive mutant. Dark color indicates phosphatase activity. (B) Photograph of a phosphatase plate assay demonstrating the range of phenotypes observed on a sample 384 plate. Coordinate I8 corresponds to the pho1Δ strain in the library. Coordinates A17 and O3 correspond to the wild type and A20 and O5 to the pho1Δ strain we included as controls. The strain at E3 is the pho7Δ strain. (C) Enlarged pictures of mutants. Mutants are shown in the bottom left corner of each tile. Both ado1Δ and aps1Δ mutants are darker in color than surrounding colonies on high-phosphate media, indicating that they are constitutive mutants, and snf5Δ and pho7Δ are lighter than the surrounding strains grown on no-phosphate media, indicating that they are uninducible mutants.
Fig. 2.
Fig. 2.
Histogram of acid phosphatase activity. Mutants' phosphatase activity was measured using PNPP as a substrate after 16 h of growth in high- and no-phosphate conditions. The strains were ordered by their phosphatase activity during phosphate starvation from least to most activity. All tests were performed in triplicate, and the errors are standard errors. The wild type (DP3) is shown in yellow.
Fig. 3.
Fig. 3.
Time course of transcript levels of pho1+ and pho84+ in a wild-type and a pho7Δ strain. DP3 and the pho7Δ strain were grown as described in Materials and Methods. Errors are standard errors of three separately grown replicates. The ratios that were normalized to 100% are pho1+/act1+ at 1.57 and pho84+/act1+ at 0.71 under phosphate starvation conditions.
Fig. 4.
Fig. 4.
Induction of pho1+ and pho84+ transcription in mutants. Transcript levels were measured by RT-qPCR in 10 uninducible mutant strains after 4 h of phosphate starvation. Errors are standard errors of three separately grown replicates. The wild-type strain (DP3) was used for normalization, and the ratio for pho1+/act1+ is 1.44 and for pho84+/act1+ is 0.41.
Fig. 5.
Fig. 5.
Levels of pho1+ and pho84+ transcript when grown in high-phosphate conditions. Transcript levels were measured by RT-qPCR in constitutive mutant strains and the wild type after 4 h of growth in high-phosphate medium. Errors are standard errors of three separately grown replicates. The wild-type strain (DP3) was used for normalization under high-phosphate conditions, and the ratio of pho1+/act1+ is 0.33 and of pho84+/act1+ is 0.19.
Fig. 6.
Fig. 6.
asp1+ is required for phosphatase expression in high-phosphate conditions. asp1+ was deleted with a KANMX6 and with a NATMX6 cassette, and deletion was confirmed by PCR. Two deletion strains as well as a G418r and NATr strain that were wild type for asp1+ were replica plated onto high- and no-phosphate agar plates and subjected to a phosphatase plate assay. The lighter color of the mutant strains in high-phosphate medium is reproducible in multiple isolates.
Fig. 7.
Fig. 7.
Epistatic tests. Double mutant strains were arrayed on solid medium with and without phosphate and subjected to a phosphatase assay. Asterisks indicate wild-type strains; both the high- and no-phosphate photographs are of identical strains.
Fig. 8.
Fig. 8.
pho7Δ and snf5Δ are not defective in the transcriptional induction of carbon- and nitrogen-regulated transcripts. Strains from the deletion collection that were mutant in the two genes and wild type (DP3) were grown in EMM plus 3% glucose medium and transferred in triplicate to either EMM 0.1% glucose plus 3% glycerol for 4 h or EMM with nitrogen for 2 h. Cells were harvested and RNA subjected to RT-qPCR as previously described.
Fig. 9.
Fig. 9.
Model of PHO pathway in two yeast species. See the introduction for a discussion of the PHO pathway in S. cerevisiae. The proposed PHO pathway in S. pombe shares at least four genes in common with S. cerevisiae, and they are indicated by the blue circles. We hypothesize that IP7 levels increase in response to phosphate starvation in a manner very similar to that of S. cerevisiae; these increased levels activate directly or indirectly the Pho7 protein (yellow circle). There are other genes involved, but their predicted role in the pathway is unclear, and they are indicated by empty circles. spcc1393.13+ and csk1+ must act upstream of the transcription factors based on epistasis experiments, but whether they regulate IP7 levels is unknown. Additionally, gpa2+ and pka1+ do not suppress the constitutive phenotypes, so they could be acting separately from the pathway, influencing IP7 levels, regulating the activation of Pho7 or Snf5 in a redundant manner, or regulating the secretion of Pho1. The genes in green circles are hypothesized to be regulating the secretion of Pho1.

References

    1. Barbaric S., Munsterkotter M., Goding C., Horz W. 1998. Cooperative Pho2-Pho4 interactions at the PHO5 promoter are critical for binding of Pho4 to UASp1 and for efficient transactivation by Pho4 at UASp2. Mol. Cell. Biol. 18:2629–2639 - PMC - PubMed
    1. Barbarić S., Munsterkotter M., Svaren J., Horz W. 1996. The homeodomain protein Pho2 and the basic-helix-loop-helix protein Pho4 bind DNA cooperatively at the yeast PHO5 promoter. Nucleic Acids Res. 24:4479–4486 - PMC - PubMed
    1. Barbet N., Muriel W. J., Carr A. M. 1992. Versatile shuttle vectors and genomic libraries for use with Schizosaccharomyces pombe. Gene 114:59–66 - PubMed
    1. Dodgson J., et al. 2009. Functional genomics of adhesion, invasion, and mycelial formation in Schizosaccharomyces pombe. Eukaryot. Cell 8:1298–1306 - PMC - PubMed
    1. Forsburg S. L., Rhind N. 2006. Basic methods for fission yeast. Yeast 23:173–183 - PMC - PubMed

Publication types

MeSH terms