

Arterial wave reflection and subclinical left ventricular systolic dysfunction
- PMID: 21169863
- PMCID: PMC3039083
- DOI: 10.1097/HJH.0b013e328342ca56
Arterial wave reflection and subclinical left ventricular systolic dysfunction
Abstract
Objectives: Increased arterial wave reflection is a predictor of cardiovascular events and has been hypothesized to be a cofactor in the pathophysiology of heart failure. Whether increased wave reflection is inversely associated with left-ventricular (LV) systolic function in individuals without heart failure is not clear.
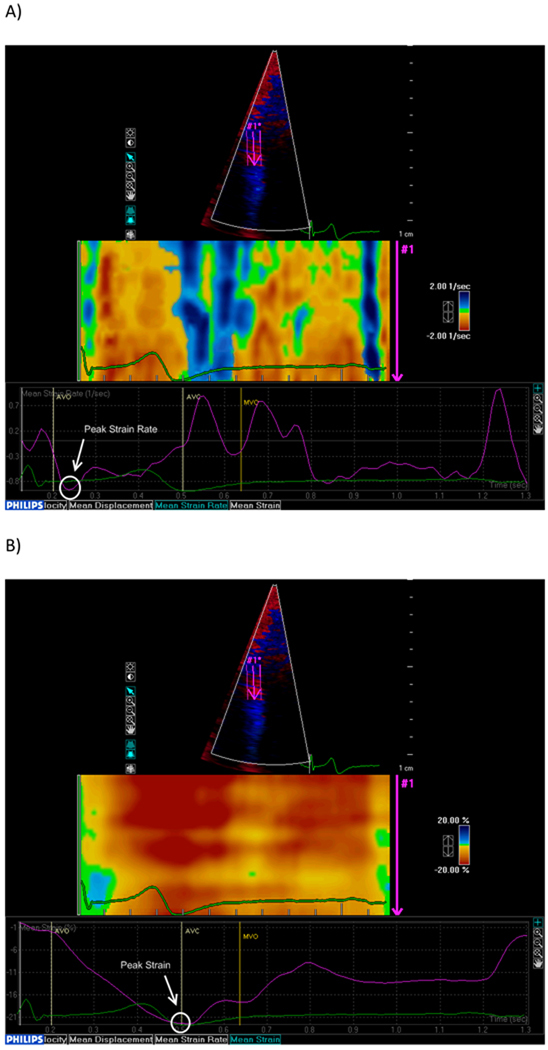
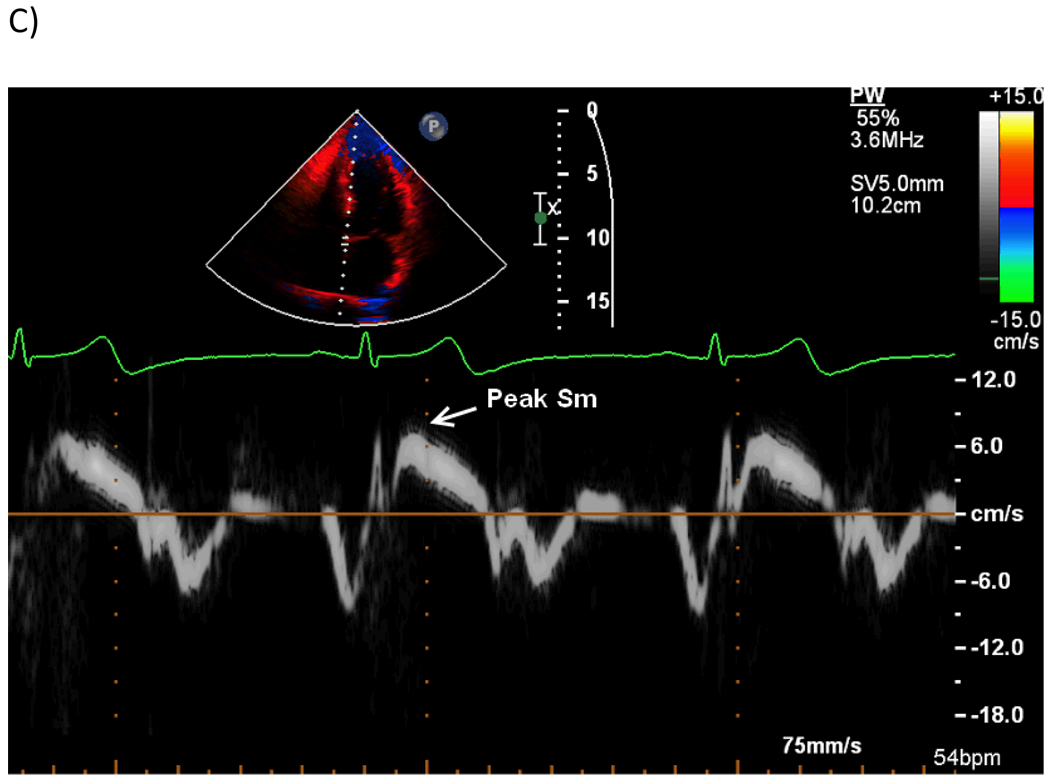
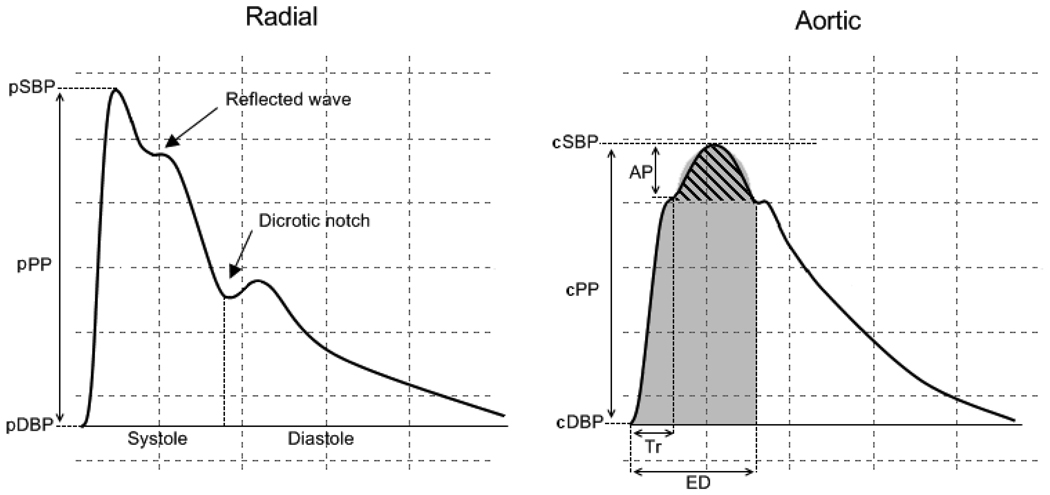
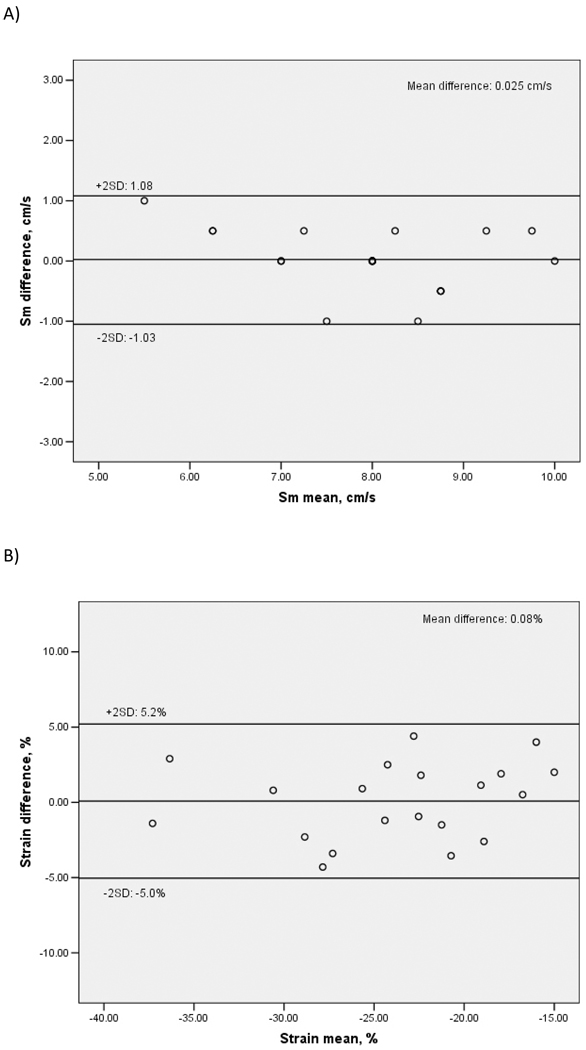
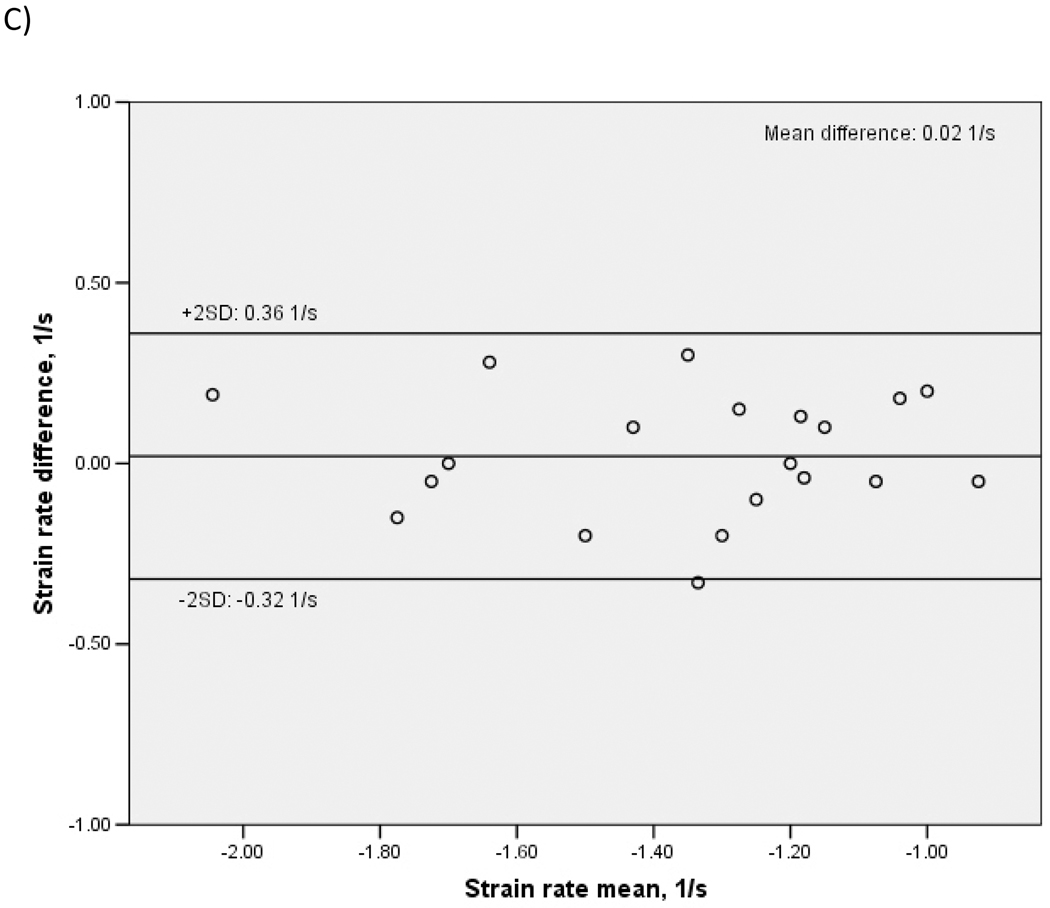
Methods: Arterial wave reflection and LV systolic function were assessed in 301 participants from the Cardiovascular Abnormalities and Brain Lesions (CABL) study using two-dimensional echocardiography and applanation tonometry of the radial artery to derive central arterial waveform by a validated transfer function. Aortic augmentation index (AIx) and wasted energy index (WEi) were used as indices of wave reflection. LV systolic function was measured by LV ejection fraction (LVEF) and tissue Doppler imaging (TDI). Mitral annulus peak systolic velocity (Sm), peak longitudinal strain and strain rate were measured. Participants with history of coronary artery disease, atrial fibrillation, LVEF less than 50% or wall motion abnormalities were excluded.
Results: Mean age of the study population was 68.3 ± 10.2 years (64.1% women, 65% hypertensive). LV systolic function by TDI was lower with increasing wave reflection, whereas LVEF was not. In multivariate analysis, TDI parameters of LV longitudinal systolic function were significantly and inversely correlated to AIx and WEi (P values from 0.05 to 0.002).
Conclusions: In a community cohort without heart failure and with normal LVEF, an increased arterial wave reflection was associated with subclinical reduction in LV systolic function assessed by novel TDI techniques. Further studies are needed to investigate the prognostic implications of this relationship.
Conflict of interest statement
Figures
References
-
- McVeigh GE, Bratteli CW, Morgan DJ, Alinder CM, Glasser SP, Finkelstein SM, et al. Age-related abnormalities in arterial compliance identified by pressure pulse contour analysis: aging and arterial compliance. Hypertension. 1999;33:1392–1398. - PubMed
-
- Asmar R, Rudnichi A, Blacher J, London GM, Safar ME. Pulse pressure and aortic pulse wave are markers of cardiovascular risk in hypertensive populations. Am J Hypertens. 2001;14:91–97. - PubMed
-
- Henry RM, Kostense PJ, Spijkerman AM, Dekker JM, Nijpels G, Heine RJ, et al. Arterial stiffness increases with deteriorating glucose tolerance status: the Hoorn Study. Circulation. 2003;107:2089–2095. - PubMed
-
- Watanabe H, Ohtsuka S, Kakihana M, Sugishita Y. Coronary circulation in dogs with an experimental decrease in aortic compliance. J Am Coll Cardiol. 1993;21:1497–1506. - PubMed
-
- Bader H. Importance of the gerontology of elastic arteries in the development of essential hypertension. Clin Physiol Biochem. 1983;1:36–56. - PubMed
Publication types
MeSH terms
Grants and funding
LinkOut - more resources
Full Text Sources
