. 2011 Feb 2;30(3):533-45.
doi: 10.1038/emboj.2010.334. Epub 2010 Dec 17.

A quantitative RNA code for mRNA target selection by the germline fate determinant GLD-1

Affiliations

A quantitative RNA code for mRNA target selection by the germline fate determinant GLD-1

Jane E Wright et al. EMBO J. .

Abstract

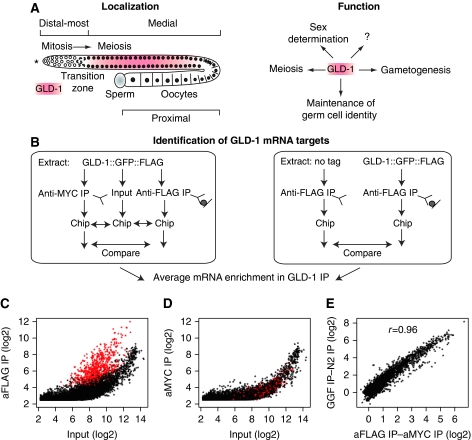
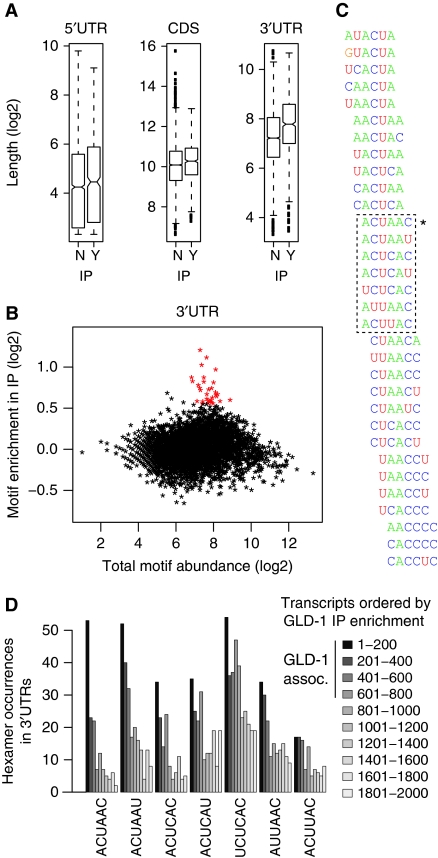
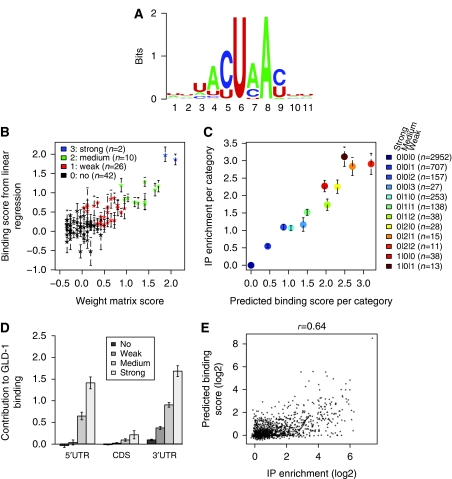
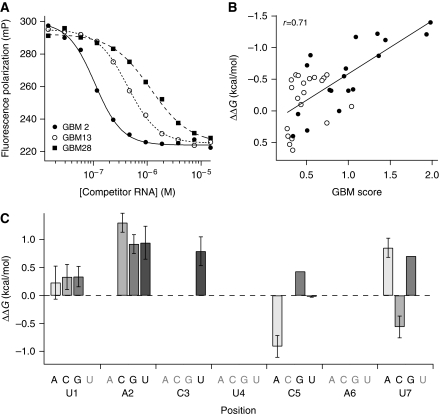
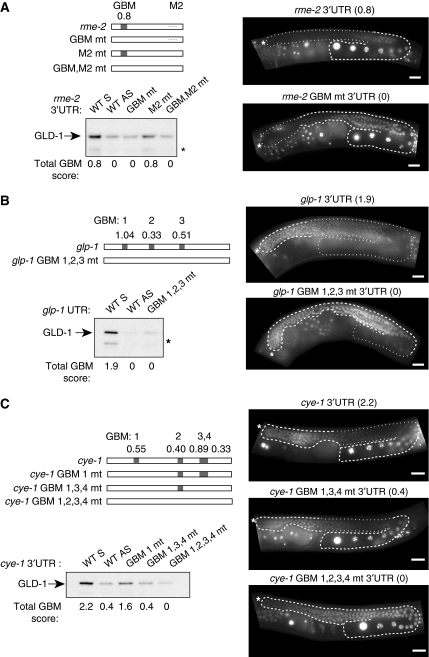
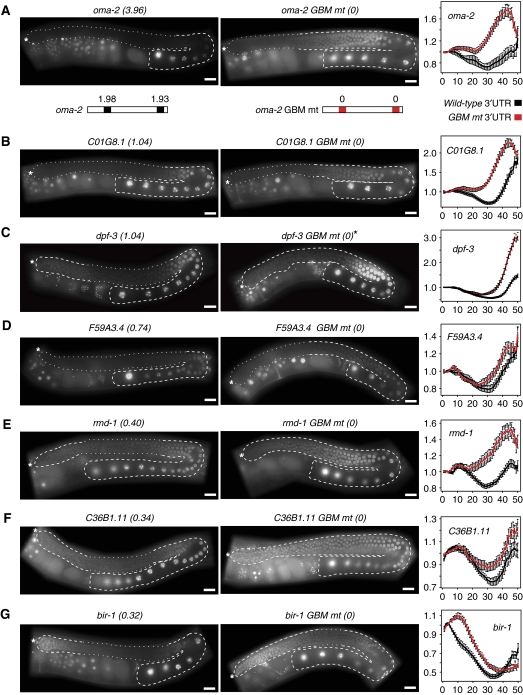
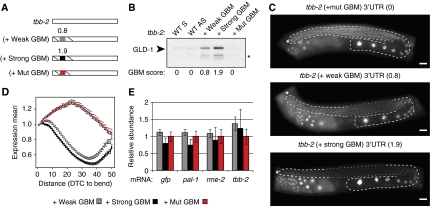
RNA-binding proteins (RBPs) are critical regulators of gene expression. To understand and predict the outcome of RBP-mediated regulation a comprehensive analysis of their interaction with RNA is necessary. The signal transduction and activation of RNA (STAR) family of RBPs includes developmental regulators and tumour suppressors such as Caenorhabditis elegans GLD-1, which is a key regulator of germ cell development. To obtain a comprehensive picture of GLD-1 interactions with the transcriptome, we identified GLD-1-associated mRNAs by RNA immunoprecipitation followed by microarray detection. Based on the computational analysis of these mRNAs we generated a predictive model, where GLD-1 association with mRNA is determined by the strength and number of 7-mer GLD-1-binding motifs (GBMs) within UTRs. We verified this quantitative model both in vitro, by competition GLD-1/GBM-binding experiments to determine relative affinity, and in vivo, by 'transplantation' experiments, where 'weak' and 'strong' GBMs imposed translational repression of increasing strength on a non-target mRNA. This study demonstrates that transcriptome-wide identification of RBP mRNA targets combined with quantitative computational analysis can generate highly predictive models of post-transcriptional regulatory networks.


Conflict of interest statement

The authors declare that they have no conflict of interest.

Figures

Figure 1
Figure 1
Identification of mRNAs associated with GLD-1. (A) GLD-1 is expressed in the medial gonad and is a key regulator of germline development, yet the majority of its biological targets are unknown. ‘Distal-most', ‘medial', and ‘proximal' indicate parts of a wild-type adult worm gonad. The asterisk here and in subsequent figures indicates the distal end of the gonad. (B) Experimental outline of GLD-1 mRNA target identification. Two independent strategies were employed: (1) comparison of anti-FLAG IP (aFLAG) to anti-MYC IP (a MYC) on extract from worms expressing tagged GLD-1 (left panel); (2) comparison of anti-FLAG IP on extract from worms expressing tagged GLD-1 (GGF_IP) to anti-FLAG IP on extract from non-tagged (N2) worms (N2_IP) (right panel). To ensure that transcripts were detected with high confidence, an input aliquot (RNA purified from extract before IP) from strategy 1 was initially used to establish an input cutoff (>5.5). (C) A large set of mRNAs (red dots) are enriched greater than three-fold in a GLD 1 IP. Comparison of aFLAG to the corresponding input. (D) GLD-1-associated mRNAs (red dots, as in C) are not enriched in a control IP. Comparison of aMYC to the corresponding input. (E) The enrichment of associated mRNAs is reproducible between complementary GLD-1 IP approaches. Comparison of aFLAG—aMYC (C, D) on the x axis, to GGF_IP—N2_IP on the y axis gives a correlation coefficient of 0.96. All mRNAs detected on the array together with their average IP enrichment are given in Supplementary Dataset S1.
Figure 2
Figure 2
GLD-1 targets are enriched for degenerate and overlapping sequences. (A) GLD-1-associated mRNAs have significantly longer 3′UTRs. The length distribution (log2) of all 3′UTRs, 5′UTRs, and CDSs is shown for both GLD-associated (Y) (greater than three-fold average IP enrichment) and non-associated (N) mRNAs. Only mRNAs with sufficient expression (>6.5) and with an annotated 5′UTR or 3′UTR were examined (Supplementary Dataset S2). (B) A subgroup of hexanucleotides is enriched in the 3′UTRs of GLD-1-associated mRNAs. For all possible hexamers (n=4096), the total number of occurrences in all 3′UTRs is depicted on the x axis, and the motif enrichment in the GLD-1-associated population on the y axis. Motif enrichment was computed for each hexanucleotide by counting the number of occurrences in GLD-1-associated 3′UTRs compared to all 3′UTRs, correcting for 3′UTR length differences. A pseudocount of 16 was added to limit enrichment values for hexanucleotides with very low number of occurrences. Red dots highlight 32 hexanucleotides enriched in the GLD-1 IP. (C) Alignment of the 32 enriched hexanucleotide sequences reveals overlapping motifs, which have sequence similarity. The asterisk indicates the highest scoring hexamer, ACUAAC and the dotted box demarcates the motif core containing other related non-overlapping variants. (D) Abundance of the core hexamers within 3′UTRs correlates with IP enrichment. The total number of occurrences of each core hexamer (indicated by the dotted box in C) was counted within sets of 200 transcripts ordered by IP enrichment. Sets corresponding to GLD-1-associated transcripts are indicated (GLD-1 assoc.).
Figure 3
Figure 3
GLD-1 binds degenerate 7-mer motifs, GBMs. (A) Identification of a GLD-1-binding motif (GBM). Weblogo of the position specific weight matrix (PSWM) detected within GLD-1 target 3′UTRs using MEME. (B) Positional nucleotide independence within the GBM. The scatter plot shows the score for the top 80 7-mers from the PSWM (A) on the x axis and the y axis indicates a coefficient of each 7-mer derived from a linear regression (which calculates the contribution of each 7-mer as a whole to GLD-1 IP enrichment). Motifs with the best average predicted binding score are shown in blue (strong), then green (medium), red (weak), and black (no predicted binding to GLD-1). For individual 7-mer scores, see Table I. (C) Multiple GBMs in a single 3′ UTR contribute to GLD-1 binding in a multiplicative fashion. All array detected transcripts with an annotated 3′UTR (n=806) were categorized depending on the number of strong, medium, and weak GBMs. For example, the ‘one medium together with two weak GBMs is denoted as (0¦1¦2). Only categories containing at least 10 3′UTRs were retained (legend). For each category the average GLD-1 IP enrichment from microarray (y axis) was compared to a predicted binding score per category (x axis). The later was computed by summing, in log space, the contribution of all GBMs present within a given 3′UTR, and subsequently by averaging the scores of all the transcripts that fall within a given category. (D) GLD-1 binds GBMs in both 5′ and 3′UTRs. Predicted relative GLD-1 binding contribution of strong, medium, and weak 7-mers in the 5′UTR, CDS, or 3′UTR was determined by linear regression (see text). (E) The sum of GBM scores is predictive of GLD-1 binding. A predicted binding score per transcript was calculated by summing, in log space, scores of any of the 80 7-mers (Table I) present in its 3′ and 5′UTR and this score compared to the actual GLD-1 IP enrichment (x axis). Comparison was limited to germline-detected transcripts (>4 tags) (Wang et al, 2009).
Figure 4
Figure 4
In vitro analysis of GLD-1 interaction with GBMs. (A) Representative example of determination of GLD-1/GBM affinities by the competition-binding assay. The relative affinity of each of the 38 GBMs was measured by competition-binding assay using purified recombinant protein. Fluorescence polarization is plotted as a function of unlabelled competitor RNA concentration for three competitor sequences containing GBMs: GBM2 (UUUCACUAACUUU, IC50,app=90±20 nM, filled circles), GBM13 (UUUUACUAAAUUU, IC50,app=400±30 nM, open circles), and GBM28 (UUUAACUCAUUUU, IC50,app=900±200 nM, filled squares). Data were fit to a sigmoidal dose response equation to determine the apparent IC50. (B) Correlation between GLD-1/GBM affinity in vitro (ΔΔG°) and in vivo (GBM score; Table I). The ΔΔG° for each of the 38 GBMs relative to the reference sequence (GBM12, UUUUACUCAUUUU, IC50,app=700±70 nM) was determined from the measured IC50 values using the following expression: ΔΔG°=−RT ln (IC50(variant)/IC50(reference)). The ΔΔG° measurement for each sequence was plotted as a function of its GBM score and fit to a line to determine the Pearson correlation coefficient (r=0.71). Filled circles represent GBMs which also score as SBEs, while open circles represent GBMs that are not identified as SBEs. (C) Context dependence of single nucleotide substitutions to GLD-1 affinity. The ΔΔG° for each sequence relative to every other sequence was determined, and the ΔΔG° for each occurrence of a single nucleotide change independent of sequence context was averaged. Each bar represents the average effect of the listed mutation at the listed position, and error bars represent context-dependent variance. Nucleotide changes in grey do not occur in the population of GBMs, and the C5G and U7G mutations are present only once and thus have no associated variance.
Figure 5
Figure 5
GBMs bind GLD-1 in vitro and mediate mRNA repression in vivo. (A) The rme-2 3′UTR interacts with GLD-1 via a GBM, which mediates regulation of a linked reporter. The top left panel shows putative GLD-1 regulatory elements within the rme-2 3′UTR and versions where they are mutated. Boxes within the 3′UTR indicate GBMs and their predictive score is above. All of the 3′UTRs depicted were tested by biotin-RNA pulldown assay for their ability to pull down tagged GLD-1 from a worm extract (bottom left panel). A GFP∷H2B reporter is repressed in the medial gonad via the GBM in the rme-2 3′UTR (right panel). Images show adult gonads expressing GFP:H2B fused to either wild-type or GBM-mutated rme-2 3′UTR. (B) GLD-1 associates with the glp-1 3′UTR via multiple GBMs. The wild-type or GBM1,2,3 mutated glp-1 3′UTRs (upper left panel) were tested for their interaction with tagged GLD-1 from a worm extract (lower left panel). Images of adult gonads expressing GFP∷H2B fused to either wild-type or GBM1,2,3 mutated glp-1 3′UTR (right panels). (C) Multiple GBMs in the cye-1 3′UTRS act in concert to increase association with and repression by GLD-1. The wild-type or GBM-mutated cye-1 3′UTRs (upper left panel) were tested in biotin-RNA pulldown assay for interaction with tagged GLD-1 (lower left panel). Right panels show images of adult gonads expressing GFP∷H2B fused to either wild-type or mutated versions of the cye-1 3′UTR, as indicated. The gonads in A, B, and C are outlined with dashed lines highlighting areas of expression and dotted lines indicating repression. The total GBM score for each 3′UTR is shown below the relevant gel lanes and also above gonad images in parentheses. *Degradation product of GLD-1. Scale bars are 20 μm.
Figure 6
Figure 6
GBMs mediate GLD-1-dependent regulation in vivo in several novel GLD-1 targets. GBMs mediate repression in the medial (GLD-1 expressing) part of the gonad (AG). Images of gonads expressing a GFP∷H2B reporter under the control of either wild-type 3′UTRs (left panels) or GBM-mutated 3′UTRs (central panels). Gonads are outlined: dashed lines highlighting expression and dotted lines repression. The 3′UTR total GBM score is in parentheses. Scale bars are 20 μm. Quantification of GFP intensity comparing wild-type and GBM-mutated 3′UTRs is shown in right most panels. Each line shows the average relative GFP intensity±s.e.m. X axis shows the relative distance across the gonad from most distal to the bend. Y axis indicates the normalized expression mean. Numbers of gonads quantified are as follows: (A) wt n=10, GBM1,2 mut n=25; (B) wt n=20, GBM mut n=27; (C) wt n=33, GBM mut n=32; (D) wt n=22, GBM mut n=22; (E) wt n=26, GBM mut n=25; (F) wt n=22, GBM mut n=20; and (G) wt n=22, GBM mut n=25. *The dpf-3 3′UTR permits expression in the most distal and proximal parts of the gonad and repression in the medial gonad. The dpf-3 GBM-mutated version is expressed more evenly across the distal and medial parts of the gonad as expected. However, there is a strong up-regulation of expression in the most proximal part, which we cannot explain.
Figure 7
Figure 7
A GBM inserted into a non-regulated 3′UTR confers strength-dependent GLD-1 binding and translational repression in vivo. (A) Schematic of the tbb-2 3′UTR or versions where the first 28 nts were replaced with 28 nts of the rme-2 3′UTR, containing either a weak, strong, or mutated GBM. (B) A strong GBM inserted into a non-target RNA sequence associates with more GLD-1 than a weak GBM. The in vitro transcribed RNAs in A were assayed for their ability to interact with tagged GLD-1. The total GBM score of each construct is shown. *GLD-1 degradation product. (C) Inserting GBMs of differing strength into the tbb-2 3′UTR causes strength-dependent repression of a GFP:H2B reporter in the medial gonad. Representative images of transgenic lines expressing a GFP:H2B reporter fused to tbb-2 (+mutated GBM), tbb-2 (+weak GBM), or tbb-2 (+strong GBM). Gonads are outlined: dashed lines highlighting expression and dotted lines repression. The total GBM score for each 3′UTR is in parentheses. Scale bars are 20 μm. (D) Quantification of GFP intensity observed in transgenic lines shown in C. The relative GFP intensity was plotted for transgenic lines where the GFP:H2B reporter is fused to the tbb-2 (+mutated GBM) 3′UTR (90 gonads, 2 strains of n=45), the tbb-2 (+weak GBM) 3′UTR (90 gonads, 2 strains of n=45), and the tbb-2 (+strong GBM) 3′UTR (90 gonads, 2 strains of n=45). Each line shows the average relative intensity across the gonad from the distal end indicated by an asterisk in C, to the gonad bend±s.e.m. (E) Quantification of mRNA levels for the transgenic lines quantified in D. The graph shows relative amounts of indicated mRNAs, determined by quantitative RT–PCR. Each bar represents an average of three independent biological replicates and error bars reflect the s.e.m. Primers for GFP were used to detect the transgenic GFP:H2B reporter in every line and three endogenous genes were also detected as controls.

Similar articles

Cited by

References

    1. Bailey TL, Elkan C (1994) Fitting a mixture model by expectation maximization to discover motifs in biopolymers. Proc Int Conf Intell Syst Mol Biol 2: 28–36 - PubMed
    1. Berger MF, Philippakis AA, Qureshi AM, He FS, Estep PW III, Bulyk ML (2006) Compact, universal DNA microarrays to comprehensively determine transcription-factor binding site specificities. Nat Biotechnol 24: 1429–1435 - PMC - PubMed
    1. Biedermann B, Hotz HR, Ciosk R (2010) The quaking family of RNA-binding proteins: coordinators of the cell cycle and differentiation. Cell Cycle 9: 1929–1933 - PubMed
    1. Biedermann B, Wright J, Senften M, Kalchhauser I, Sarathy G, Lee MH, Ciosk R (2009) Translational repression of cyclin E prevents precocious mitosis and embryonic gene activation during C. elegans meiosis. Dev Cell 17: 355–364 - PubMed
    1. Ciosk R, DePalma M, Priess JR (2006) Translational regulators maintain totipotency in the Caenorhabditis elegans germline. Science (New York, NY) 311: 851–853 - PubMed

Publication types

MeSH terms

Associated data