. 2009 Aug;11(6):1251-1310.
doi: 10.1007/s11051-009-9632-z. Epub 2009 May 26.

In quest of a systematic framework for unifying and defining nanoscience

Affiliations

In quest of a systematic framework for unifying and defining nanoscience

Donald A Tomalia. J Nanopart Res. 2009 Aug.

Abstract

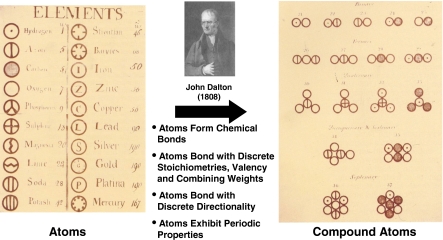
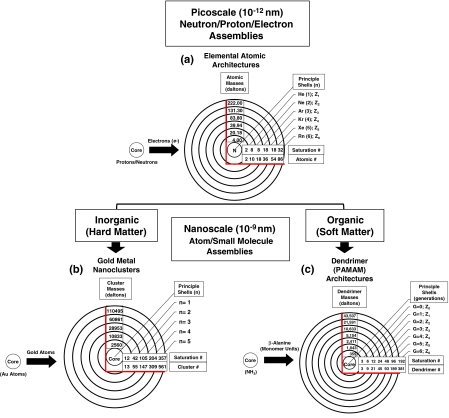
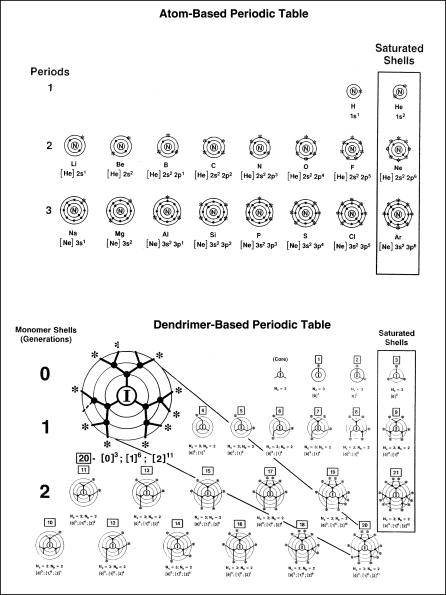
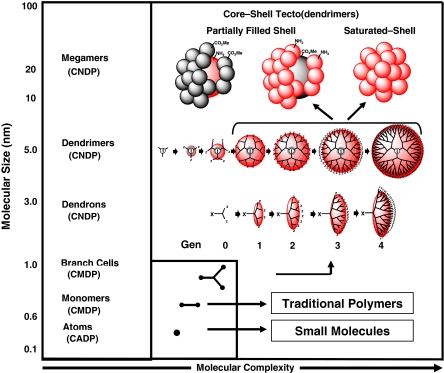
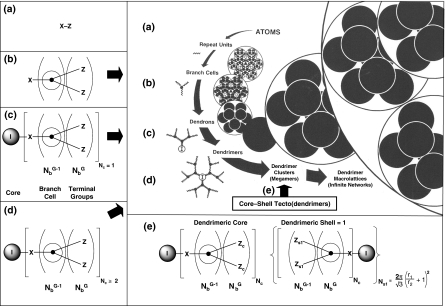
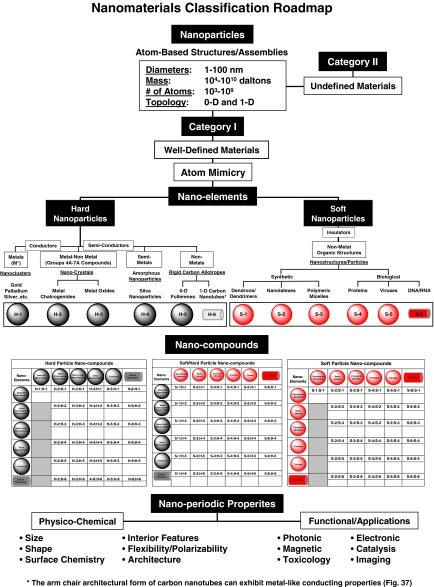
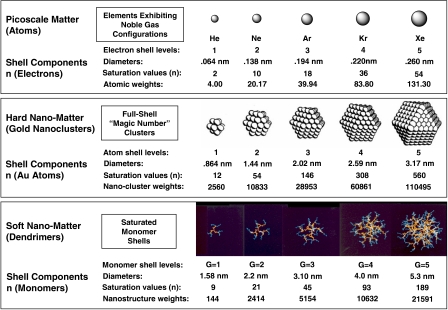
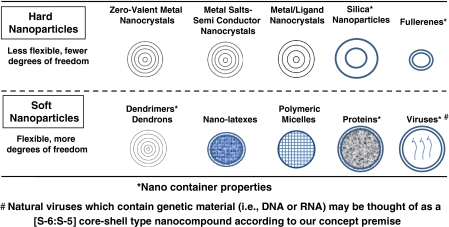
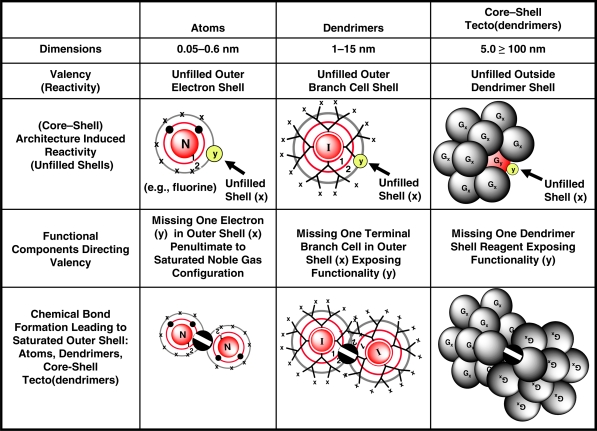
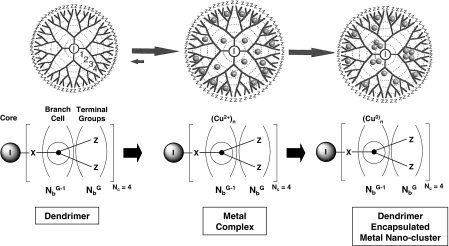
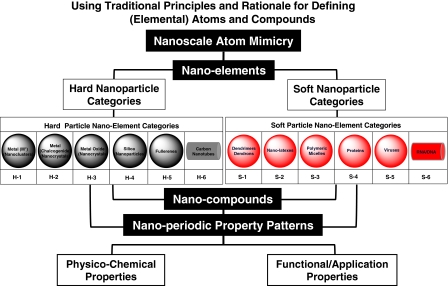
This article proposes a systematic framework for unifying and defining nanoscience based on historic first principles and step logic that led to a "central paradigm" (i.e., unifying framework) for traditional elemental/small-molecule chemistry. As such, a Nanomaterials classification roadmap is proposed, which divides all nanomatter into Category I: discrete, well-defined and Category II: statistical, undefined nanoparticles. We consider only Category I, well-defined nanoparticles which are >90% monodisperse as a function of Critical Nanoscale Design Parameters (CNDPs) defined according to: (a) size, (b) shape, (c) surface chemistry, (d) flexibility, and (e) elemental composition. Classified as either hard (H) (i.e., inorganic-based) or soft (S) (i.e., organic-based) categories, these nanoparticles were found to manifest pervasive atom mimicry features that included: (1) a dominance of zero-dimensional (0D) core-shell nanoarchitectures, (2) the ability to self-assemble or chemically bond as discrete, quantized nanounits, and (3) exhibited well-defined nanoscale valencies and stoichiometries reminiscent of atom-based elements. These discrete nanoparticle categories are referred to as hard or soft particle nanoelements. Many examples describing chemical bonding/assembly of these nanoelements have been reported in the literature. We refer to these hard:hard (H-n:H-n), soft:soft (S-n:S-n), or hard:soft (H-n:S-n) nanoelement combinations as nanocompounds. Due to their quantized features, many nanoelement and nanocompound categories are reported to exhibit well-defined nanoperiodic property patterns. These periodic property patterns are dependent on their quantized nanofeatures (CNDPs) and dramatically influence intrinsic physicochemical properties (i.e., melting points, reactivity/self-assembly, sterics, and nanoencapsulation), as well as important functional/performance properties (i.e., magnetic, photonic, electronic, and toxicologic properties). We propose this perspective as a modest first step toward more clearly defining synthetic nanochemistry as well as providing a systematic framework for unifying nanoscience. With further progress, one should anticipate the evolution of future nanoperiodic table(s) suitable for predicting important risk/benefit boundaries in the field of nanoscience. ELECTRONIC SUPPLEMENTARY MATERIAL: The online version of this article (doi:10.1007/s11051-009-9632-z) contains supplementary material, which is available to authorized users.


Figures

Fig. 1
Fig. 1
Dalton’s first table of elemental atoms and their conversion to compound atoms according to his atom/molecular hypotheses. Key components of traditional chemistry “central dogma” based on his hypothesis. Images reproduced with permission from (Heilbronner and Dunitz 1993). Copyright: Wiley-VCH Verlag GmbH & Co. KGaA
Fig. 2
Fig. 2
a Illustration of elemental atomic core–shell architecture describing four critical parameters: (i) atomic masses (daltons) (i.e., at each electron shell saturation level), (ii) principle shell numbers (n), (iii) shell saturation numbers (Zn), and (iv) atomic number (i.e., total number of electrons in atom). b Illustration of gold metal nanocluster core–shell architectures describing four critical parameters: (i) cluster masses (daltons) at each shell saturation level, (ii) principle cluster shell numbers (n), (iii) cluster shell saturation numbers (Zn) (closed atom shell values) = 10n2 + 2 (Schmid 1990), and (iv) cluster number (i.e., total number of gold atoms in nanocluster). c illustration of dendrimer core–shell architectures describing four critical parameters: (i) dendrimer masses (daltons) at each shell saturation level (generations), (ii) principle dendrimer monomer shell numbers (n), (generations), (iii) dendrimer monomer shell saturation numbers (Zn) (closed monomer shell values) = NcNbG, where Nc = core shell multiplicity, Nb = branch shell multiplicity, G = generation or (n) principle monomer shell number, and (iv) dendrimer number (i.e., total number of monomer units in the dendrimer or degree of polymerization)
Fig. 3
Fig. 3
An example of atom mimicry. A comparison of core–shell structures representing picoscale atoms and nanoscale dendrimers, as well as the continuum of sizes that prevails over the 2D ranges that are controlled by quantum mechanics and Newtonian physics, respectively
Fig. 4
Fig. 4
A comparison of abbreviated atom-based and dendrimer-based periodic tables (Tomalia 1994) for the first three periods
Fig. 5
Fig. 5
Approximate nanoscale dimensions as a function of atoms, monomers, branch cells, dendrons, dendrimers, and megamers
Fig. 6
Fig. 6
Critical mathematically defined intermediates involved in bottom-up synthesis strategies leading to dendrons, dendrimers, and core–shell dendrimer clusters (megamers)
Fig. 7
Fig. 7
Nanomaterials classification roadmap
Fig. 8
Fig. 8
Comparison of atomic picoscale particles, hard nanoparticles, and soft nanoparticles. Center image Hard-Matter. Reprinted from Schmid (1990). Copyright (1990), with permission from Elsevier
Fig. 9
Fig. 9
Taxonomy of proposed 0D core–shell nanoelements
Fig. 10
Fig. 10
a Schematic illustration of a (M55)55 giant cluster. b Giant clusters of different magic nuclearities, (Pd561)n, the circles corresponding to the diameters of the clusters calculated on the basis of the effective volume of an individual nanocrystal, and c TEM image of Pd561 nanocrystals forming giant clusters. The numbers correspond to the proposed number of nanocrystal shells, n. Reprinted with permission from Thomas et al. (2001). Copyright: 2001 American Chemical Society
Fig. 11
Fig. 11
Quantized module reactivity patterns at the sub-nanoscale (atoms), lower nanoscale (dendrimers), and higher nanoscale [core–shell tecto(dendrimer)] levels involving outer unsaturated electron, monomer, or dendrimer principal valence shells
Fig. 12
Fig. 12
Comparison of periodic polarization/crystallization properties observed for picoscale atoms and nanoscale modules (i.e., surface-modified metal nanoclusters) (Ozin and Arsenault 2005). Reproduced by permission from the Royal Society of Chemistry
Fig. 13
Fig. 13
Scheme of gold nanoparticle assembly methodologies. Reprinted by Macmillan Publishers Ltd.: Nature (Park et al. 2008)
Fig. 14
Fig. 14
Hard and soft nanoelement categories
Fig. 15
Fig. 15
Strategy for surface functionalization to produce monovalent gold nanoparticles. Reprinted with permission from Kruger et al. (2008). Copyright: 2008 American Chemical Society
Fig. 16
Fig. 16
Dimerization after coupling with 1,7-heptandiamine. Reprinted with permission from Kruger et al. (2008). Copyright: 2008 American Chemical Society
Fig. 17
Fig. 17
a Side view and b top view of a rippled gold nanoparticle. Two polar defects allow the alternation of parallel rings of the two thiol ligands OT (yellow) and MPA (red). c Polymerization of the carboxy-functionalized nanoparticles with 1,7 diaminohexane (DAH). Reprinted from DeVries et al. (2007). Copyright (2007), with permission from AAAS
Fig. 18
Fig. 18
High-resolution TEM images of different types of heterodimers: (a) γ-Fe2O3–CdS. Reprinted with permission from Kwon and Shim (2005). Copyright: 2005 American Chemical Society (b) CoPt3–Au; (c) Fe3O4–Au. Reprinted with permission from Shi et al. (2006). Copyright: 2006 American Chemical Society (d) Fe3O4–Ag (e) FePt–Ag; (f) Au–Ag. Reprinted with permission from Gu et al. (2005). Copyright: 2005 American Chemical Society
Fig. 19
Fig. 19
Rafts of bimodal nanoparticles forming a ordered AB2 and b ordered AB superlattice arrays (Kiely et al. 2000). Copyright: Wiley-VCH Verlag GmbH & Co. KGaA
Fig. 20
Fig. 20
TEM micrographs and sketches of AB13 superlattices of 11-nm γ-Fe2O3 and 6-nm PbSe NCs: a cubic subunit of the AB13 unit cell; b AB13 unit cell built up of eight cubic subunits; c projection of a [100]SL plane at high magnification; d same as c but at low magnification [(inset) small-angle electron diffraction pattern from a corresponding 6-μm2 area]; e depiction of a [100] plane; f projection of a [110]SL plane; g same as f but at high magnification; h depiction of the projection of the [110] plane; i small-angle electron diffraction pattern from a 6-μm2 [110]SL area; and j wide-angle electron diffraction pattern of an AB13-superlattice (SAED of a 6-μm2 area) with indexing of the main diffraction rings for PbSe and γ-Fe2O3. Reprinted by permission from Macmillan Publishers Ltd.: Nature (Redl et al. 2003)
Fig. 21
Fig. 21
a Incorporation of core–shell–shell (CSS)-quantum dots (QDs) into silica nanoparticles by the reverse micelle method. b and c Surface modification of the (CSS-QD) produces a water soluble form possessing PEG or gadolinium moieties suitable for MRI. Reprinted with permission from Koole et al. (2008). Copyright: 2008 American Chemical Society
Fig. 22
Fig. 22
a TEM image of monodisperse particles (31 nm) with a single QD (7.7 nm) incorporated in the center. b–d Normalized size distributions, absorption/emission spectra, and relaxivities of the (CSS-QDs). Reprinted with permission from Koole et al. (2008). Copyright: 2008 American Chemical Society
Fig. 23
Fig. 23
Tapping mode AFM images of G = 9; PAMAM dendrimer molecules on a mica surface (Fréchet and Tomalia 2001)
Fig. 24
Fig. 24
The saturated-shell-architecture approach to megamer synthesis. All surface dendrimers are carboxylic acid terminated (Uppuluri et al. 2000)
Fig. 25
Fig. 25
Comparison of a a single G = 9, dendrimer; b a supramolecular G = 9, nanocluster [G = 9]7; c a core–shell tecto(dendrimer) [G = 7]:[G = 5]12 covalently bonded nanocluster compound; and d the G = 9 alone and in its e cluster form versus f the [G = 7]:[G = 5]12 nanocompound when imaged on a mica substrate. Reprinted with permission from Betley et al. (2002). Copyright: 2002 American Chemical Society
Fig. 26
Fig. 26
Step A The unsaturated-shell-architecture approach to megamer synthesis. Step B describes surface-capping reactions (Tomalia et al. 2002)
Fig. 27
Fig. 27
Synthesis of dendronized nanolatexes; generation n, NLGnT. Inset: scaled cross section of a dendronized nanoparticle NLG1T showing the thin G1T shell as CPK space-filling molecular model (Larpent et al. 2004). Reproduced by permission of the Royal Society of Chemistry (Larpent et al. 2004)
Fig. 28
Fig. 28
Protein–dendron nanocompounds. a BSA–dendron (Gen. = 1) and b BSA–Dendron (Gen. = 2); Cys-34 and the attached dendron are shown in red. Reprinted with permission from Kostiainen et al. (2007). Copyright: 2007 American Chemical Society
Fig. 29
Fig. 29
Ligand exchange of citrate-protected QDs with phosphine focal point-functionalized poly(ether) dendrons (Huang and Tomalia 2006). Reprinted from Huang and Tomalia (2006). Copyright (2006), with permission from Elsevier
Fig. 30
Fig. 30
Dendrimer core–fullerene-shell nanocompounds, where Z = peripheral –NH2 or –NH (PAMAM) dendrimer core surface groups and n = 30–32 fullerene shell components in the core–shell nanocompounds. Reprinted with permission from Jensen et al. (2005). Copyright: 2005 American Chemical Society
Fig. 31
Fig. 31
Room temperature synthesis of [nanolatex(core): POM (shell)]-type nanocompounds. Reproduced with permission from Cannizzo et al. (2005). Copyright: Wiley-VCH Verlag GmbH & Co. KGaA.
Fig. 32
Fig. 32
The relationship between gold-nanocluster size, the total number of atoms in full (saturated) shell, metal clusters and their melting points. Reproduced with permission from Klabunde (2001). Copyright: Wiley-VCH Verlag GmbH & Co. KGaA.
Fig. 33
Fig. 33
Nanoperiodic Raleigh light scattering (LSPR) properties of silver nanoclusters as a function of size with associated TEM images illustrating monodispersities. Reproduced with permission from Mirkin (2005). Copyright: Wiley-VCH Verlag GmbH & Co. KGaA.
Fig. 34
Fig. 34
Nanoperiodic fluorescence emission properties for semiconducting QD as a function of composition, band-gap mismatch, and size (Alivisatos 1996). Reprinted from Alivisatos (1996). Copyright (1996), with permission from AAAS
Fig. 35
Fig. 35
Nanoperiodic magnetic-field induced retention properties as a function of metal oxide [H-3]-type nanoelement size (Yavuz et al. 2006). Reprinted from Yavuz et al. (2006). Copyright (2006), with permission from AAAS
Fig. 36
Fig. 36
Surface chemistry-dependent nanotoxicity properties. Surface chemistries associated with human dermal fibroblast live/dead cell viability assay results for C60 and its derivatives. Reprinted with permission from Sayes et al. (2004). Copyright: 2004 American Chemical Society
Fig. 37
Fig. 37
Electronic properties of two different carbon nanotubes. a The armchair (5,5) nanotube exhibits a metallic behavior (finite value of charge carriers in the DOS at the Fermi energy, located at zero). b The zigzag (7,0) nanotube is a small-gap semiconductor (no charge carriers in the DOS at the Fermi energy). Sharp spikes in the DOS are van Hove singularities (a, b). Reprinted with permission from Charlier (2002). Copyright: 2002 American Chemical Society
Fig. 38
Fig. 38
Comparison of surface area/head group (Z), refractive index, density (d), and viscosity (η) as a function of generation G = 1–9 (Fréchet and Tomalia 2001). Copyright: Wiley-VCH Verlag GmbH & Co. KGaA
Fig. 39
Fig. 39
Congestion-induced dendrimer shape changes (I, II, and III) with development of nanocontainer properties for a family of poly(amidoamine) (PAMAM) dendrimers: Nc = 4; Nb = 2, where ZZ = distance between surface groups as a function of generation
Fig. 40
Fig. 40
Structural design of dendrons as a function of their size, shape, surface chemistry, flexibility, and composition to produce a wide variety of self-assembled nanocompounds. Reprinted with permission from Percec et al. (2007). Copyright: 2007 American Chemical Society
Fig. 41
Fig. 41
Small self-complementary 16-residue polypeptide nanoelements that organize into “self-assembled peptide nanofiber scaffoldings” (SAPNS) and exhibit substantive adhesion to extracellular matrices (Ellis-Behnke et al. 2006a, b). Reproduced from Ellis-Behnke et al. (2006b). Copyright 2006, with permission from National Academy of Sciences, USA
Fig. 42
Fig. 42
Periodic functional properties of “self-assembled peptide nanofiber scaffoldings” (SAPNS): a time to hemostasis for various lesion sites; b bleeding duration for 4 mm liver punch; c bleeding duration for 4 mm skin punch; and d duration of hemostasis as a function of concentration (Ellis-Behnke et al. 2006a, b). Reprinted from Ellis-Behnke et al. (2006a). Copyright (2006), with permission from Elsevier
Fig. 43
Fig. 43
Generalized patterns (±) illustrating in vitro nanotoxicity, biopermeability, and immunogenic properties as a function of dendrimer surface chemistry. Reprinted with permission from Tomalia et al. (2007b). Copyright: 2007 Biochemical Society, London
Fig. 44
Fig. 44
Hard and soft particle nanoelements exhibiting nanoencapsulation properties that are dependent on guest size/composition as well as on interior features of nanoelement hosts. This is a property common to both hard and soft particle nanoelement hosts. Hosts are arranged as a function of size (left to right), and order generally approximates the size and amount of guest nanoencapsulation that is possible
Fig. 45
Fig. 45
a Transmission electron micrograph of negatively stained virus-like particles obtained from functionalized gold nanoparticles (black centers, 12 nm diameter) and BMV capsid protein. b Comparison of encapsulation yields for citrate: Au with the previous protocol8, Au:TEG, and native RNA. Averaged transmission electron micrograph of c empty BMV capsid, d citrate-coated VLP, and e TEG-coated VLP. The averages have been obtained by the superposition of 10 individual images, in each case. Reprinted with permission from Chen et al. (2006). Copyright: 2006 American Chemical Society
Fig. 46
Fig. 46
a Symmetry properties of core–shell structures, where r1/r2 < 1.20. b Sterically induced stoichiometry based on the respective radii of core and shell dendrimers. c Mansfield–Tomalia–Rakesh equation for calculating the maximum shell filling when r1/r2 > 1.20. Reprinted with permission from Tomalia (2005) (Elsevier)
Fig. 47
Fig. 47
Simplified illustration of the proposed (Au55) superstructure formation in the matrix of excess dendrimers. These peel off the PPh3 and Cl ligands from Au55(pph3)12Cl and thus allow cluster–cluster interactions, which subsequently leads to the observed microcrystals (Schmid et al. 2000). Copyright: Wiley-VCH Verlag GmbH & Co. KGaA
Fig. 48
Fig. 48
Spheroidal-type nanodots (SONDs) and dumb-bell-like organic nanodots (DONDs) (Mongin et al. 2007). Reproduced by permission from The Royal Society of Chemistry (RSC) for the Centre National de la Recherche Scientifique (CNRS) and the RSC
Fig. 49
Fig. 49
a Nanoperiodic, two-photon fluorescence properties for various Au nanoclusters as a function of cluster sizes b absorbance of Au25 versus wavelength (nm). Note the two-photon absorption cross section (TPA) in c suggests a periodic transition between cluster Au309 and particle Au976. Reprinted with permission from Ramakrishna et al. (2008). Copyright: 2009 American Chemical Society
Fig. 50
Fig. 50
Poly(amidoamine) (PAMAM) dendrimer generations 1–9 are scaled as spheroids. They are presented with their respective diameter sizes (nm) and proton relaxivity values, R1 (mM−1 s−1). Complete and rapid renal excretion is observed by MRI for generations smaller than G = 6. Liver (bile) pathways are observed for dendrimer generations larger than G = 6. MRI Images at bottom. Reprinted with permission from Kobayashi et al. (2003). Copyright (2003), with permission from BC Decker
Fig. 51
Fig. 51
Optical resonances of gold shell–silica core nanoshells as a function of their core/shell ratio. Respective spectra correspond to the nanoparticles depicted beneath (Loo et al. 2004). Published with permission from Loo et al. (2004). Copyright 2004: http://www.tcrt.org
Fig. 52
Fig. 52
Core/shell ratio as a function of resonance wavelength for gold/silica nanoshells (Loo et al. 2004). Published with permission from Loo et al. (2004). Copyright 2004: http://www.tcrt.org
Fig. 53
Fig. 53
Formation of dendronized gold nanoparticles. Reprinted from Huang and Tomalia (2005). Copyright (2005), with permission from Elsevier
Fig. 54
Fig. 54
Summary of the band offsets (in eV) and lattice mismatch (in %) between the core InAs and the III–V semiconductor shells (left side), and II–VI semiconductor shells (right side) grown in this study. CB Conduction band; VB valence band. Reprinted with permission from Cao and Banin (2000). Copyright: 2000 American Chemical Society
Fig. 55
Fig. 55
Nanoperiodic absorption/emission properties for a series of mismatched lattice band gap, semiconducting, metal chalcogenide core–shell nanoparticles (Xie et al. 2008). Reproduced by permission from Springer. Reproduced with permission of the authors Xie et al. (2008)
Fig. 56
Fig. 56
a SAXS plots shown after background subtraction and normalization. b The systematic increase in inter-particle spacing, as the PAMAM generation increased (average spacing: d (Å) 2ð/q). Reprinted with permission from Frankamp et al. (2005). Copyright: 2005 American Chemical Society
Fig. 57
Fig. 57
Field-cooled (FC) and zero-field-cooled (ZFC) magnetization plots for each sample showing the steady decrease in TB (magnetism), as the particles are spaced farther apart from one another. Reprinted with permission from Frankamp et al. (2005). Copyright: 2005 American Chemical Society
Fig. 58
Fig. 58
Construction of a dendrimer-encapsulated metal nanocluster (DEN) involving a metal salt (Cu+2) encapsulation and b reduction to (Cu0) (Balogh and Tomalia 1998)
Fig. 59
Fig. 59
a Plot of the rate of hydrogen consumption as a function of particle diameter. b Plot of the total, calculated numbers of surface, defect, and face atoms for each particle size. The data are normalized to the largest number of each type of atom. Reprinted with permission from Wilson et al. (2006). Copyright: 2006 American Chemical Society
Fig. 60
Fig. 60
Concept overview: using first principles and step logic that led to the “central dogma” for traditional chemistry, the criteria of nanoscale atom mimicry was applied to Category I-type, well-defined nanoparticles. This produced 12 proposed nanoelement categories which were classified into six hard particle and six soft particle nanoelement categories. Chemically bonding or assembling these hard and soft nanoelements leads to hard:hard, soft:hard, or soft:soft type nanocompound categories, many of which have been reported in the literature. Based on the discrete, quantized features associated with the proposed nanoelements and their compounds, an abundance of nanoperiodic property patterns related to their intrinsic physicochemical and functional/application properties have been observed and reported in the literature

References

    1. Aldana J, Wang Y, et al. Photochemical instability of CdSe nanocrystals coated by hydrophilic thiols. J Am Chem Soc. 2001;123:8844–8850. doi: 10.1021/ja016424q. - DOI - PubMed
    1. Alivisatos AP.Semiconductor clusters, nanocrystals, and quantum dots Science 1996271933–937.1996Sci...271..933A10.1126/science.271.5251.933 - DOI
    1. Anderson PW.More is different Science 1972177393–396.1972Sci...177..393A10.1126/science.177.4047.393 - DOI - PubMed
    1. Andres R, Jesus E, et al. Catalysts based on palladium dendrimers. New J Chem. 2007;31:1161–1191. doi: 10.1039/b615761k. - DOI
    1. Azamian BR, Coleman KS et al. (2002) Directly observed covalent coupling of quantum dots to single-wall carbon nanotubes. Chem Commun 366–367 - PubMed

LinkOut - more resources