. 2010 Dec 9;6(12):e1001028.
doi: 10.1371/journal.pcbi.1001028.

A scalable approach for discovering conserved active subnetworks across species

Affiliations

A scalable approach for discovering conserved active subnetworks across species

Raamesh Deshpande et al. PLoS Comput Biol. .

Abstract

Overlaying differential changes in gene expression on protein interaction networks has proven to be a useful approach to interpreting the cell's dynamic response to a changing environment. Despite successes in finding active subnetworks in the context of a single species, the idea of overlaying lists of differentially expressed genes on networks has not yet been extended to support the analysis of multiple species' interaction networks. To address this problem, we designed a scalable, cross-species network search algorithm, neXus (Network-cross(X)-species-Search), that discovers conserved, active subnetworks based on parallel differential expression studies in multiple species. Our approach leverages functional linkage networks, which provide more comprehensive coverage of functional relationships than physical interaction networks by combining heterogeneous types of genomic data. We applied our cross-species approach to identify conserved modules that are differentially active in stem cells relative to differentiated cells based on parallel gene expression studies and functional linkage networks from mouse and human. We find hundreds of conserved active subnetworks enriched for stem cell-associated functions such as cell cycle, DNA repair, and chromatin modification processes. Using a variation of this approach, we also find a number of species-specific networks, which likely reflect mechanisms of stem cell function that have diverged between mouse and human. We assess the statistical significance of the subnetworks by comparing them with subnetworks discovered on random permutations of the differential expression data. We also describe several case examples that illustrate the utility of comparative analysis of active subnetworks.


Conflict of interest statement

The authors have declared that no competing interests exist.

Figures
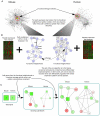
Figure 1
Figure 1. A method for discovering conserved active subnetworks across species.
(A) The flowchart describes the growth of a subnetwork from a candidate seed gene (red) in the functional linkage network. (B) Genes that are functionally related to the seed are defined as those whose path confidence from the seed gene is above a certain threshold (colored yellow in A), and are considered to be the functional neighborhood of the seed. The aim of the approach is to integrate the expression data with functional linkage networks and discover active conserved subnetworks. (C) The candidate subnetwork initially contains the seed gene and is grown by adding genes iteratively from the functional neighborhood so as to maximize the average expression activity score of the genes in the subnetwork. At all iteration steps, the connectivity constraint must be satisfied before a candidate gene is added. The nodes in the growing subnetworks are genes and the edge-weights are derived from the functional linkage network in either species. The genes are colored green if they are up-regulated in stem cells relative to differentiated cells and red if they are down-regulated in stem cells relative to differentiated cells. The color intensity represents the expression normalized fold change in either direction.
Figure 2
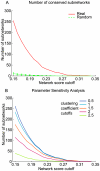
Figure 2. Evaluation of conserved subnetworks.
(A) The cross-species algorithm mines subnetworks in the functional linkage network with a high density of differentially expressed genes. The network score of a subnetwork reflects the average differential activity of all genes in the network. The number of subnetworks identified at a network score threshold is plotted (solid line) and is compared to the number of subnetworks identified after differential expression scores were randomly shuffled (dotted line). The parameters for average clustering coefficient are 0.1 for mouse and 0.2 for human. (B) The number of conserved subnetworks discovered is plotted for a range of connectedness parameters (minimum clustering coefficient). All clustering coefficients noted are relative to the background, single-gene average clustering coefficient, which is 0.08 for mouse and 0.35 for human.
Figure 3
Figure 3. Functional summaries of the subnetworks.
The 2D hierarchically clustered matrix of subnetworks' functions highlights functional enrichments based on Gene Ontology annotations (biological process category) for the mouse counterparts of all conserved active subnetworks. A subnetwork column is colored green if the subnetwork contained genes predominantly up-regulated in stem cells, red if the genes in the subnetwork are up-regulated in differentially expressed cells, and yellow, if the subnetwork contains mixed genes, some of which are more highly expressed in stem cells and some in differentiated cells. Enrichment was measured for all GO terms (Bonferroni-corrected p<0.05), and the enrichment patterns were clustered to reveal patterns of enrichment across the subnetworks. Enriched GO Terms for individual subnetworks have been uploaded on the subnetworks website and can be browsed at http://csbio.cs.umn.edu/neXus/subnetworks. The enriched GO Terms for stem cells, differentiated cells and mixed subnetworks can be found in Table S5.
Figure 4
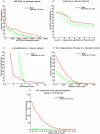
Figure 4. Comparison with other methods.
The number of real subnetworks and random subnetworks at various network score cutoffs are plotted for MATISSE (A), Ingenuity (B), jActiveModules (C) and the single-species version of our algorithm (D). The network scores are the metric used by each algorithm to rank the subnetworks. Random subnetworks were obtained by running respective algorithms on the expression data, whose gene labels have been randomly shuffled. Each of the methods uses different forms of the expression data: MATISSE uses expression profiles; jActiveModules uses significance values of the genes; Ingenuity uses focus genes, for which we took any differential expressed gene whose log fold change value was greater (lesser) than 20% of the maximum (minimum) of the most up-regulated (down-regulated) gene; Our method uses fold change scores from the SAM analysis. The scale of the functional linkage network was reduced for all methods shown in (A–D) for a fair comparison. The cross species algorithm on the full network has also been shown for a complete comparison (E).
Figure 5
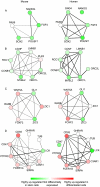
Figure 5. Examples of conserved subnetworks.
Subnetworks (A–D) are examples of interesting conserved subnetworks discovered by the cross-species network search algorithm on differentially expressed genes between stem cells and differentiated cells. Each subnetwork represents a subgraph of mouse (left column) and human (right column) functional linkage networks, respectively. Nodes are genes and they are colored green if the gene is up-regulated in stem cells when compared to differentiated cells and red if down-regulated in stem cells relative to differentiated cells. The intensity of green or red color of the genes represents the normalized fold change of the expression. The edge thickness in the subnetworks represents the edge confidence based on the functional linkage networks. The subnetwork (A) shows a conserved subnetwork which contains important stem cell transcription factors. The subnetwork (B) highlights cell cycle related pathway genes. The subnetworks (C, D) are mixed subnetworks, as they contain both up-regulated and down-regulated genes. The genes are functionally related but their mode of function is antagonistic in nature.
Figure 6
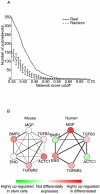
Figure 6. Species specific subnetwork.
(A) The number of species-specific subnetworks discovered is plotted versus the network score cutoffs and compared with the number of subnetworks generated by applying the same approach after randomly shuffling gene labels in the expression data. Species-specific networks represent subnetworks with highly divergent patterns across species. (B) An example species-specific subnetwork that highlights the difference in expression of BMP2 pathway related subnetwork in human and mouse. The subnetwork nodes are genes, whose color represent whether are they are active in stem-cells (green) or differentiated cells (red) and intensity of the color represent the degree of expression activity. The thickness of edges of the subnetwork represents the edge confidence based on the functional-linkage network.

References

    1. Tusher VG, Tibshirani R, Chu G. Significance analysis of microarrays applied to the ionizing radiation response. Proc Natl Acad Sci U S A. 2001;98:5116–5121. - PMC - PubMed
    1. van 't Veer LJ, Dai H, van de Vijver MJ, He YD, Hart AA, et al. Gene expression profiling predicts clinical outcome of breast cancer. Nature. 2002;415:530–536. - PubMed
    1. Sladek R, Rocheleau G, Rung J, Dina C, Shen L, et al. A genome-wide association study identifies novel risk loci for type 2 diabetes. Nature. 2007;445:881–885. - PubMed
    1. Costanzo M, Baryshnikova A, Bellay J, Kim Y, Spear ED, et al. The genetic landscape of a cell. Science. 2010;327:425–431. - PMC - PubMed
    1. Ideker T, Ozier O, Schwikowski B, Siegel AF. Discovering regulatory and signalling circuits in molecular interaction networks. Bioinformatics. 2002;18:S233–240. - PubMed

Publication types