

Expression profiling of formalin-fixed paraffin-embedded primary breast tumors using cancer-specific and whole genome gene panels on the DASL® platform
- PMID: 21172013
- PMCID: PMC3022545
- DOI: 10.1186/1755-8794-3-60
Expression profiling of formalin-fixed paraffin-embedded primary breast tumors using cancer-specific and whole genome gene panels on the DASL® platform
Abstract
Background: The cDNA-mediated Annealing, extension, Selection and Ligation (DASL) assay has become a suitable gene expression profiling system for degraded RNA from paraffin-embedded tissue. We examined assay characteristics and the performance of the DASL 502-gene Cancer Panel v1 (1.5K) and 24,526-gene panel (24K) platforms at differentiating nine human epidermal growth factor receptor 2- positive (HER2+) and 11 HER2-negative (HER2-) paraffin-embedded breast tumors.
Methods: Bland-Altman plots and Spearman correlations evaluated intra/inter-panel agreement of normalized expression values. Unequal-variance t-statistics tested for differences in expression levels between HER2 + and HER2 - tumors. Regulatory network analysis was performed using Metacore (GeneGo Inc., St. Joseph, MI).
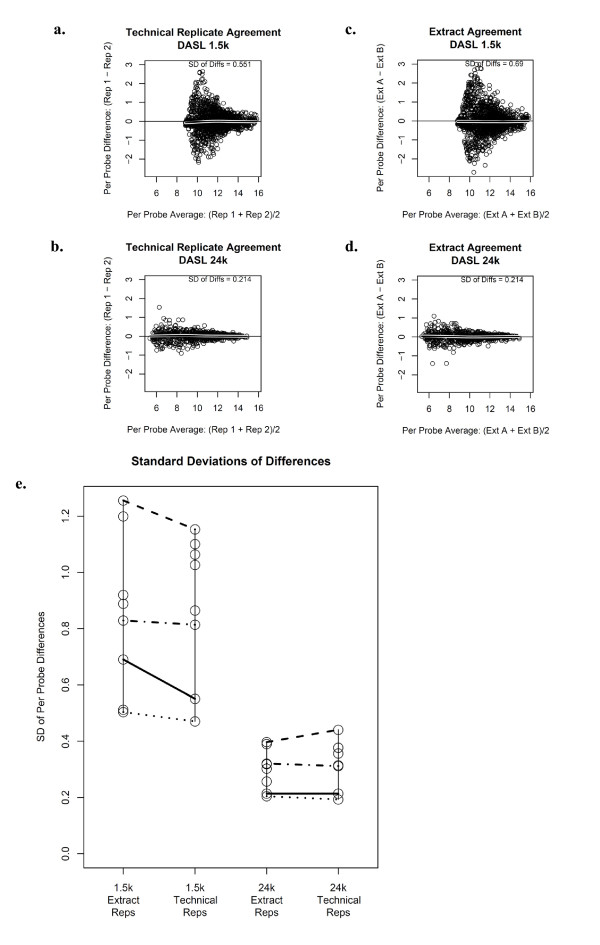
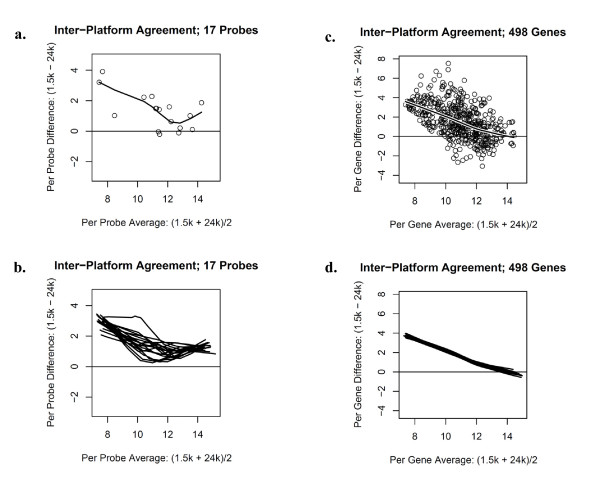
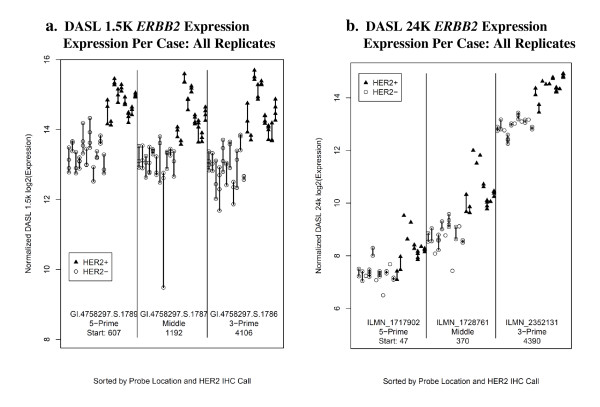
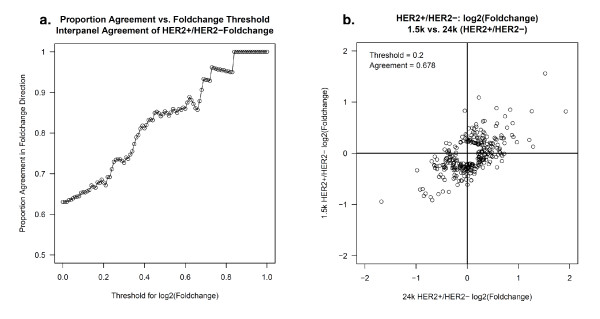
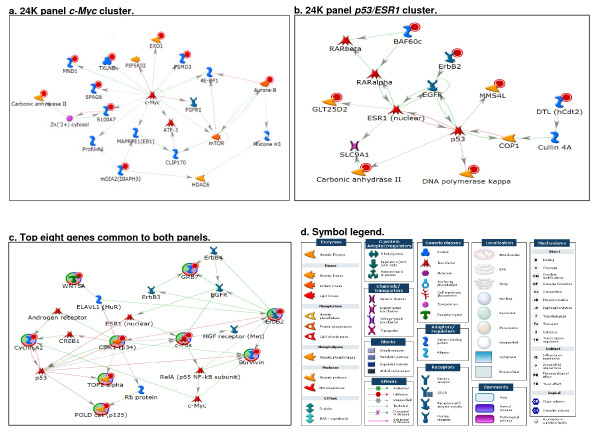
Results: Technical replicate correlations ranged between 0.815-0.956 and 0.986-0.997 for the 1.5K and 24K panels, respectively. Inter-panel correlations of expression values for the common 498 genes across the two panels ranged between 0.485-0.573. Inter-panel correlations of expression values of 17 probes with base-pair sequence matches between the 1.5K and 24K panels ranged between 0.652-0.899. In both panels, erythroblastic leukemia viral oncogene homolog 2 (ERBB2) was the most differentially expressed gene between the HER2 + and HER2 - tumors and seven additional genes had p-values < 0.05 and log2 -fold changes > |0.5| in expression between HER2 + and HER2 - tumors: topoisomerase II alpha (TOP2A), cyclin a2 (CCNA2), v-fos fbj murine osteosarcoma viral oncogene homolog (FOS), wingless-type mmtv integration site family, member 5a (WNT5A), growth factor receptor-bound protein 7 (GRB7), cell division cycle 2 (CDC2), and baculoviral iap repeat-containing protein 5 (BIRC5). The top 52 discriminating probes from the 24K panel are enriched with genes belonging to the regulatory networks centered around v-myc avian myelocytomatosis viral oncogene homolog (MYC), tumor protein p53 (TP53), and estrogen receptor α (ESR1). Network analysis with a two-step extension also showed that the eight discriminating genes common to the 1.5K and 24K panels are functionally linked together through MYC, TP53, and ESR1.
Conclusions: The relative RNA abundance obtained from two highly differing density gene panels are correlated with eight common genes differentiating HER2 + and HER2 - breast tumors. Network analyses demonstrated biological consistency between the 1.5K and 24K gene panels.
Figures
Similar articles
-
Molecular characterisation of formalin-fixed paraffin-embedded (FFPE) breast tumour specimens using a custom 512-gene breast cancer bead array-based platform.Br J Cancer. 2011 Nov 8;105(10):1574-81. doi: 10.1038/bjc.2011.355. Br J Cancer. 2011. PMID: 22067903 Free PMC article.
-
Reliable gene expression profiling of formalin-fixed paraffin-embedded breast cancer tissue (FFPE) using cDNA-mediated annealing, extension, selection, and ligation whole-genome (DASL WG) assay.BMC Med Genomics. 2016 Aug 20;9(1):54. doi: 10.1186/s12920-016-0215-4. BMC Med Genomics. 2016. PMID: 27542606 Free PMC article.
-
Technical validation of an RT-qPCR in vitro diagnostic test system for the determination of breast cancer molecular subtypes by quantification of ERBB2, ESR1, PGR and MKI67 mRNA levels from formalin-fixed paraffin-embedded breast tumor specimens.BMC Cancer. 2016 Jul 7;16:398. doi: 10.1186/s12885-016-2476-x. BMC Cancer. 2016. PMID: 27389414 Free PMC article.
-
Clinical relevance of DNA microarray analyses using archival formalin-fixed paraffin-embedded breast cancer specimens.BMC Cancer. 2011 Jun 16;11:253:1-13. doi: 10.1186/1471-2407-11-253. BMC Cancer. 2011. PMID: 21679412 Free PMC article.
-
Illumina whole-genome complementary DNA-mediated annealing, selection, extension and ligation platform: assessing its performance in formalin-fixed, paraffin-embedded samples and identifying invasion pattern-related genes in oral squamous cell carcinoma.Hum Pathol. 2011 Dec;42(12):1911-22. doi: 10.1016/j.humpath.2011.02.011. Epub 2011 Jun 17. Hum Pathol. 2011. PMID: 21683979
Cited by
-
Genome-wide expression assay comparison across frozen and fixed postmortem brain tissue samples.BMC Genomics. 2011 Sep 10;12:449. doi: 10.1186/1471-2164-12-449. BMC Genomics. 2011. PMID: 21906392 Free PMC article.
-
Enhanced stability of microRNA expression facilitates classification of FFPE tumour samples exhibiting near total mRNA degradation.Br J Cancer. 2012 Aug 7;107(4):684-94. doi: 10.1038/bjc.2012.294. Epub 2012 Jul 17. Br J Cancer. 2012. PMID: 22805332 Free PMC article.
-
Multi-Omics Analysis Reveals a HIF Network and Hub Gene EPAS1 Associated with Lung Adenocarcinoma.EBioMedicine. 2018 Jun;32:93-101. doi: 10.1016/j.ebiom.2018.05.024. Epub 2018 May 31. EBioMedicine. 2018. PMID: 29859855 Free PMC article.
-
Gene expression modules in primary breast cancers as risk factors for organotropic patterns of first metastatic spread: a case control study.Breast Cancer Res. 2017 Oct 13;19(1):113. doi: 10.1186/s13058-017-0881-y. Breast Cancer Res. 2017. PMID: 29029636 Free PMC article.
-
Expression profiling of archival tumors for long-term health studies.Clin Cancer Res. 2012 Nov 15;18(22):6136-46. doi: 10.1158/1078-0432.CCR-12-1915. Epub 2012 Nov 7. Clin Cancer Res. 2012. PMID: 23136189 Free PMC article.
References
-
- Perez E, Enui A. In: Breast Cancer and Molecular Medicine. Piccart MJ, Wood WC, Hung C-M, Solin LJ, Cardoso F, editor. Berlin: Springer; 2006. Molecular Profiling in Breast Cancer; pp. 977–1006. full_text.
-
- Perou CM, Sorlie T, Eisen MB, van de Rijn M, Jeffrey SS, Rees CA, Pollack JR, Ross DT, Johnsen H, Akslen LA, Fluge O, Pergamenschikov A, Williams C, Zhu SX, Lonning PE, Borresen-Dale AL, Brown PO, Botstein D. Molecular portraits of human breast tumours. Nature. 2000;406(6797):747–752. doi: 10.1038/35021093. - DOI - PubMed
-
- Sorlie T, Perou CM, Tibshirani R, Aas T, Geisler S, Johnsen H, Hastie T, Eisen MB, van de Rijn M, Jeffrey SS, Thorsen T, Quist H, Matese JC, Brown PO, Botstein D, Eystein Lonning P, Borresen-Dale AL. Gene expression patterns of breast carcinomas distinguish tumor subclasses with clinical implications. Proc Natl Acad Sci USA. 2001;98(19):10869–10874. doi: 10.1073/pnas.191367098. - DOI - PMC - PubMed
Publication types
MeSH terms
Substances
Grants and funding
LinkOut - more resources
Full Text Sources
Medical
Molecular Biology Databases
Research Materials
Miscellaneous
