Review
. 2010 Dec 22;68(6):1023-42.
doi: 10.1016/j.neuron.2010.11.032.

Sleep state switching

Affiliations
Review

Sleep state switching

Clifford B Saper et al. Neuron. .

Abstract

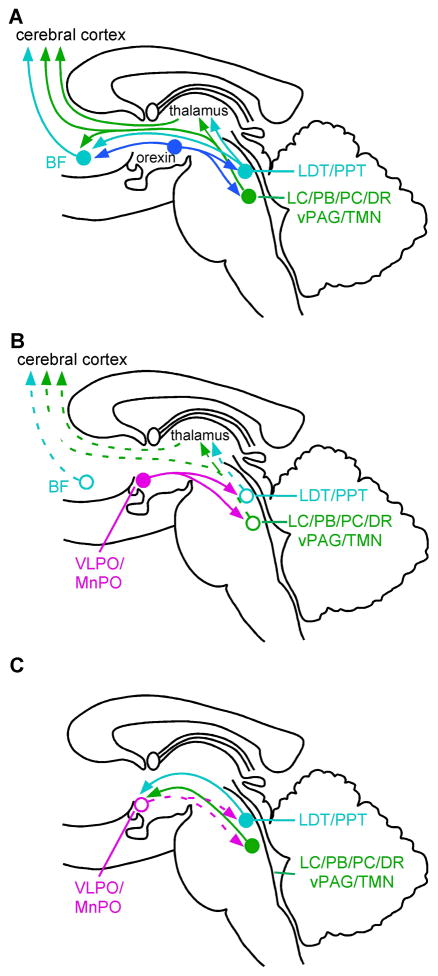
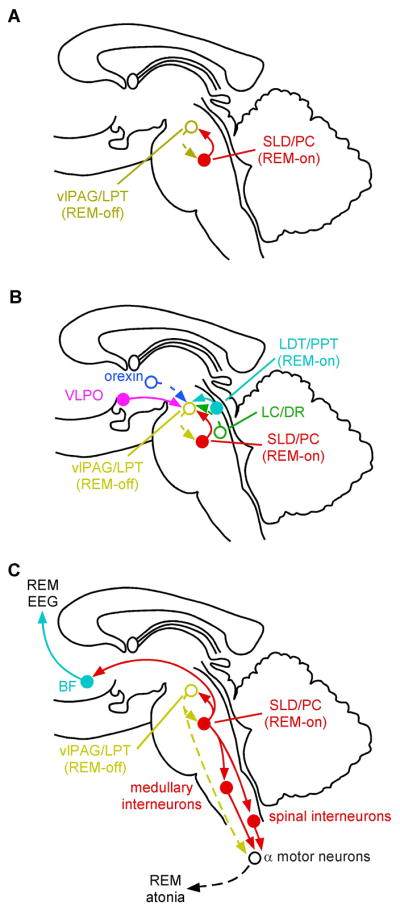
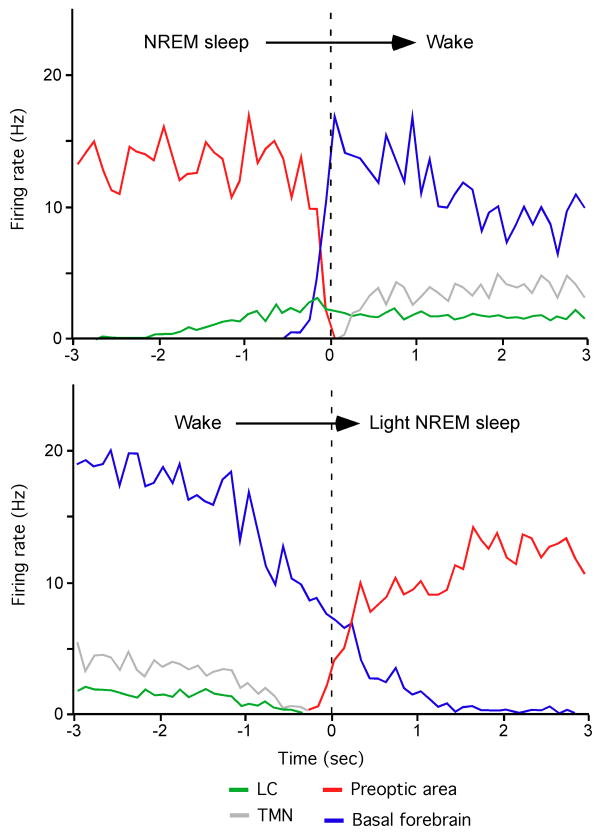
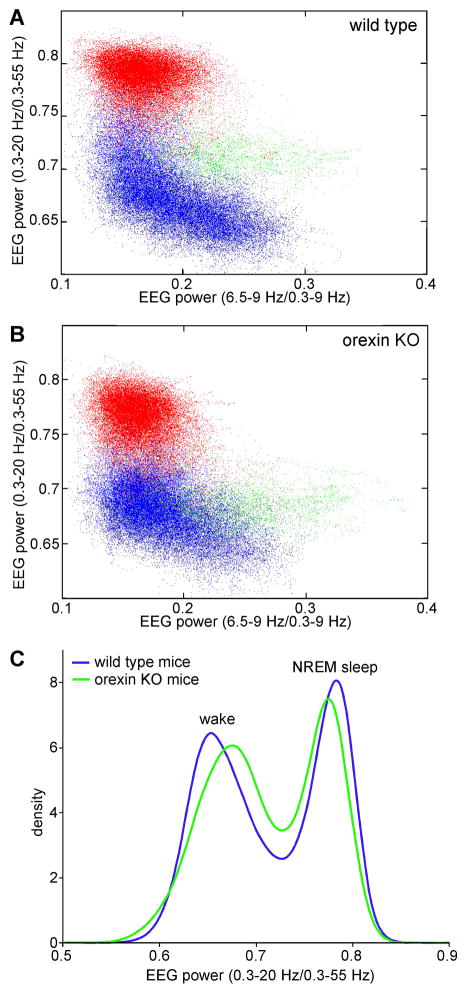
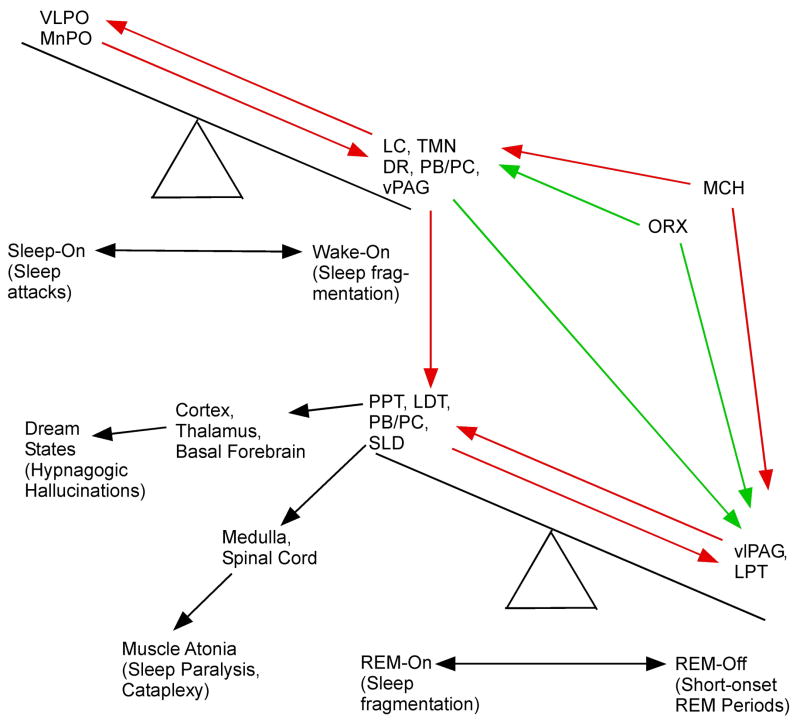
We take for granted the ability to fall asleep or to snap out of sleep into wakefulness, but these changes in behavioral state require specific switching mechanisms in the brain that allow well-defined state transitions. In this review, we examine the basic circuitry underlying the regulation of sleep and wakefulness and discuss a theoretical framework wherein the interactions between reciprocal neuronal circuits enable relatively rapid and complete state transitions. We also review how homeostatic, circadian, and allostatic drives help regulate sleep state switching and discuss how breakdown of the switching mechanism may contribute to sleep disorders such as narcolepsy.


Figures

Figure 1
Figure 1. The wake-sleep switch
Many wake-promoting projections arise from neurons in the upper brainstem (A). Cholinergic neurons (aqua) provide the major input to the thalamus, whereas monoaminergic and (presumably) glutamatergic neurons (dark green) provide direct innervation of the the hypothalamus. basal forebrain, and cerebral cortex. The orexin neurons in the lateral hypothalamus (blue) reinforce activity in these brainstem arousal pathways and also directly excite the cerebral cortex and BF. The main sleep-promoting pathways (magenta in B) from the ventrolateral (VLPO) and median (MnPO) preoptic nuclei inhibit the components of the ascending arousal pathways in both the hypothalamus and the brainstem (pathways that are inhibited are shown as open circles and dashed lines). However, the ascending arousal systems are also capable of inhibiting the VLPO (C). This mutually inhibitory relationship of the arousal- and sleep-promoting pathways produces the conditions for a “flip-flop” switch, which can generate rapid and complete transitions between waking and sleeping states. Abbreviations: DR, dorsal raphe nucleus (serotonin); LC, locus coeruleus (norepinephrine); LDT, laterodorsal tegmental nucleus (acetylcholine); PB, parabrachial nucleus (glutamate); PC, precoeruleus area (glutamate); PPT, pedunculopontine tegmental nucleus (acetylcholine); TMN, tuberomammillary nucleus (histamine); vPAG, ventral periaqueductal gray (dopamine).
Figure 2
Figure 2. The REM-NREM sleep switch
Two populations of mutually inhibitory neurons in the upper pons form a switch for controlling transitions between REM and NREM sleep (A). GABAergic neurons in the ventrolateral periaqueductal gray matter and the adjacent lateral pontine tegmentum (vlPAG/LPT; shown in gold) fire during non-REM states to inhibit entry into REM sleep. During REM sleep, they are inhibited by a population of GABAergic neurons in the sublaterodorsal region (SLD, red) that fire during REM sleep. This mutually inhibitory relationship produces a REM- NREM “flip-flop” switch, promoting rapid and complete transitions between these states. The core REM switch is in turn modulated by other neurotransmitter systems (B). Noradrenergic neurons in the LC and serotoninergic neurons in the DR (green) inhibit REM sleep by actions on both sides of the “flip-flop” switch (exciting REM-off and inhibiting REM-on neurons), and during REM sleep they are silent (dashed lines); whereas cholinergic neurons (aqua) promote REM sleep by having opposite actions on the same two neuronal populations. The orexin neurons inhibit entry into REM sleep by exciting neurons in the REM-off population (and by presynaptic effects that excite monoaminergic terminals), whereas the VLPO neurons promote the entry into REM sleep by inhibiting this same target. During REM sleep (C), a separate population of glutamatergic neurons in the SLD (red) activates a series of inhibitory interneurons in the medulla and spinal cord, which inhibit motor neurons, thus producing the atonia of REM sleep. Withdrawal of tonic excitatory input from the REM-off regions may also contribute to the loss of muscle tone. At the same time, ascending projections from glutamatergic neurons in the PB and PC activate forebrain pathways that drive EEG desynchronization and hippocampal theta rhythms, thus producing the characteristic EEG signs of REM sleep.
Figure 3
Figure 3. Reciprocol firing patterns between sleep-promoting neurons in the preoptic area and wake-promoting neurons in the LC, TMN, and basal forebrain
The top panel shows changes in firing rate during the transition from NREM sleep to wake and the bottom panel shows firing rates during the transition from wake into light NREM sleep. Note that the firing rates of some cell groups, such as the LC, begin to increase or decrease 1–2 sec in advance of awakening or falling asleep, suggesting that they may help drive the transition. In contrast, neurons in the TMN begin to fire only after the transition to wake, suggesting these cells may play more of a role in maintenance of wakefulness. Recordings were made in unanesthetized, head-restrained mice. Adapted with permission from (Takahashi et al., 2010).
Figure 4
Figure 4. Space state analysis of the EEG enables visualization of distinct sleep/wake states and switching between states
By segmenting the EEG power spectrum into ranges, and comparing ratios of EEG power in different ranges, it is possible to produce graphs that separate the different wake-sleep states spatially. Higher values on the X-axis represent greater amounts of theta activity (6.5 to 9 Hz) which is characteristic of active wake and REM sleep. Higher values on the Y-axis reflect greater amounts of slow EEG activity as is characteristic of NREM sleep. In these graphs, the ratios of power in different EEG bands are computed for each second of EEG activity, which is plotted as a separate point. The EEG and EMG are then scored by experimenters, who designate each second as wake (blue), NREM sleep (red), REM sleep (green), or cataplexy (magenta). In a wild type mouse (A), the clusters of EEG activity associated with each state are distinct, but in a narcoleptic mouse lacking orexin peptides (B), the wake and NREM sleep clusters are closer together with more periods spent in the region between these states. Panel C shows the average densities of EEG activity as a function of low frequency EEG power (a projection of the cluster plots above into the Y axis) in groups of wild type mice (n=6) and orexin knockout mice (n=7). Wild type mice (blue line) spend most of their time (high densities) in well-defined wake and NREM sleep, but orexin knockout mice (green line) spend more time in the transitional region between wake and NREM sleep, in part due to the greater number of state transitions in these mice.
Figure 5
Figure 5. Summary of the cascading wake-sleep and REM-NREM “flip-flop” switches, and how they are both stabilized by orexin neurons
The populations of wake- and sleep-promoting neurons are shown as components of a counterpoised switch at the upper left, and the REM-on and REM-off populations at the lower right. (Red arrows indicate inhibitory projections, green arrows excitatory ones.) The monoaminergic arousal neurons that inhibit the VLPO during wakefulness also inhibit the REM-on and excite the REM-off neurons in the REM switch, thus making it nearly impossible for normal individuals to transition directly from wakefulness to a REM state. On the other hand, when there is loss of orexin signaling in narcolepsy, both switches become destabilized, and their normal cascading relationship is disrupted, so that it is possible for individuals with narcolepsy to enter fragmentary components of REM sleep (cataplexy, sleep paralysis, hypnagogic hallucinations) directly from the waking state. The clinical phenomena encountered in narcolepsy when each population of wake-, sleep-, or REM-promoting neurons fires at the wrong time is identified in parentheses.

References

    1. Achermann P, Borbely AA. Mathematical models of sleep regulation. Front Biosci. 2003;8:s683–s693. - PubMed
    1. Adamantidis A, Salvert D, Goutagny R, Lakaye B, Gervasoni D, Grisar T, Luppi PH, Fort P. Sleep architecture of the melanin-concentrating hormone receptor 1-knockout mice. Eur J Neurosci. 2008;27:1793–1800. - PubMed
    1. Adamantidis AR, Zhang F, Aravanis AM, Deisseroth K, de LL. Neural substrates of awakening probed with optogenetic control of hypocretin neurons. Nature. 2007;450:420–424. - PMC - PubMed
    1. Adametz JH. Rate of recovery of functioning in cats with rostral reticular lesions. J Neurosurg. 1959;16:85–98. - PubMed
    1. Asanuma C. Axonal arborizations of a magnocellular basal nucleus input and their relation to the neurons in the thalamic reticular nucleus of rats. Proc Natl Acad Sci U S A. 1989;86:4746–4750. - PMC - PubMed

Publication types

LinkOut - more resources