. 2010 Dec 22;40(6):939-53.
doi: 10.1016/j.molcel.2010.12.011.

Genome-wide identification of polycomb-associated RNAs by RIP-seq

Affiliations

Genome-wide identification of polycomb-associated RNAs by RIP-seq

Jing Zhao et al. Mol Cell. .

Abstract

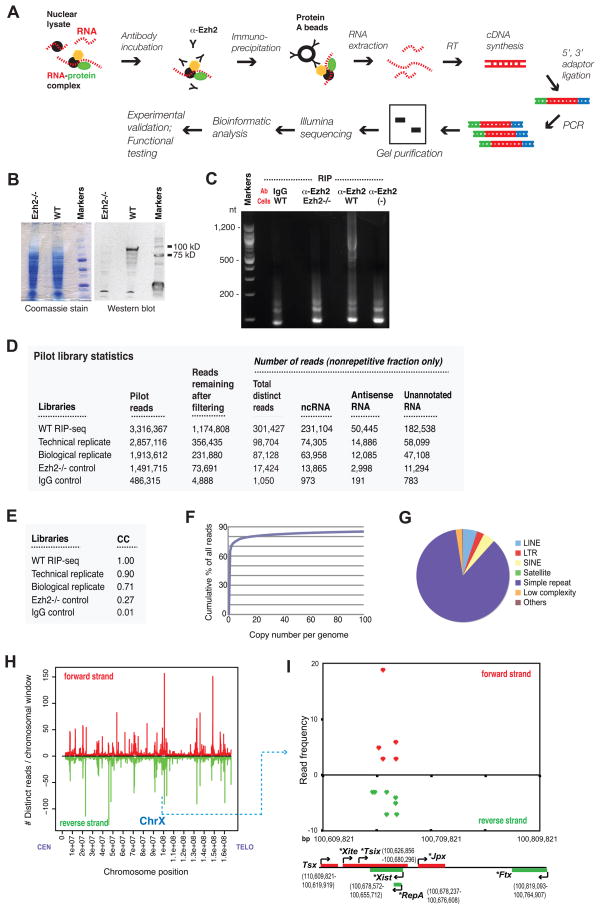
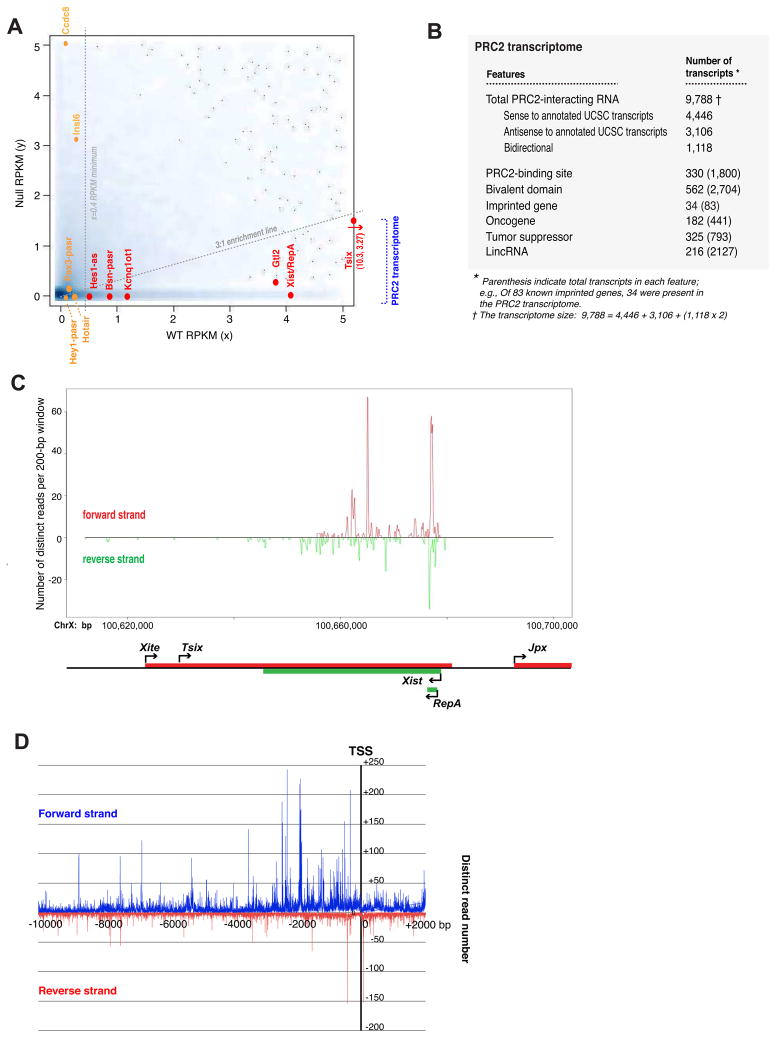
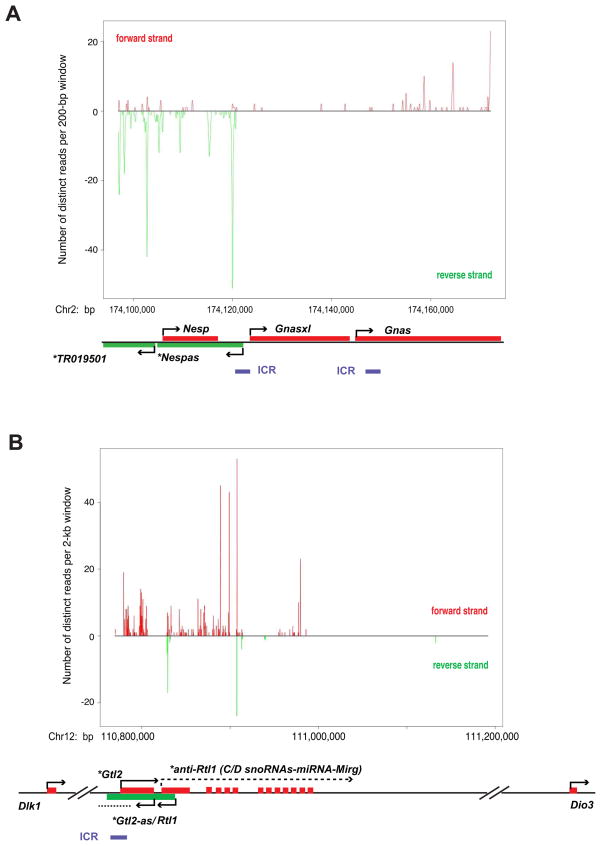
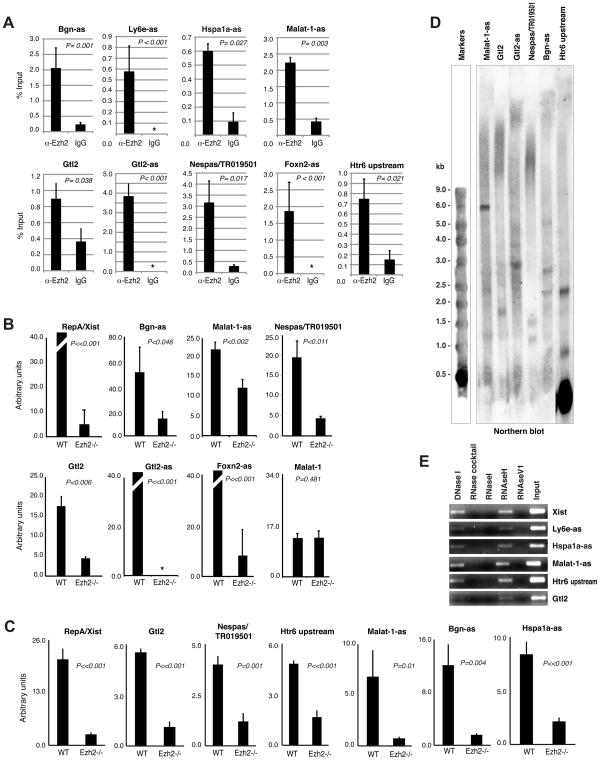
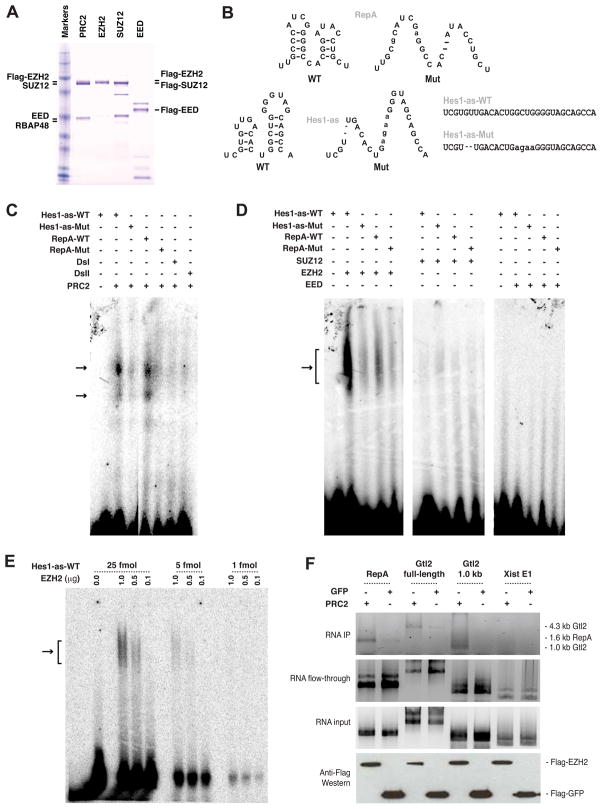
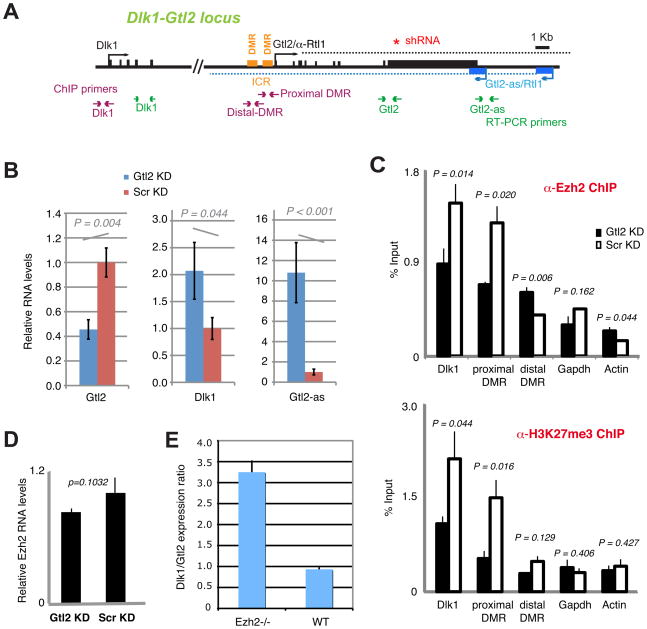
Polycomb proteins play essential roles in stem cell renewal and human disease. Recent studies of HOX genes and X inactivation have provided evidence for RNA cofactors in Polycomb repressive complex 2 (PRC2). Here we develop a RIP-seq method to capture the PRC2 transcriptome and identify a genome-wide pool of >9000 PRC2-interacting RNAs in embryonic stem cells. The transcriptome includes antisense, intergenic, and promoter-associated transcripts, as well as many unannotated RNAs. A large number of transcripts occur within imprinted regions, oncogene and tumor suppressor loci, and stem cell-related bivalent domains. We provide evidence for direct RNA-protein interactions, most likely via the Ezh2 subunit. We also identify Gtl2 RNA as a PRC2 cofactor that directs PRC2 to the reciprocally imprinted Dlk1 coding gene. Thus, Polycomb proteins interact with a genome-wide family of RNAs, some of which may be used as biomarkers and therapeutic targets for human disease.


Figures

Figure 1
Figure 1. The RIP-seq technique and analysis of pilot libraries
A. RIP-seq schematic. B. Western blot analysis (right panel) of Ezh2 protein in wildtype (WT) and Ezh2−/− ES cells. Coomassie staining (left panel) shows equal loading. C. Preparatory agarose gel for RIP product size selection. D. Pilot library statistics for WT and control libraries for an equivalent number of cells (column 2), reads after filtering using criteria shown in Fig. S1 (column 3), and distinct reads after removing duplicates and repetitive elements (column 4). E. CCs of indicated libraries in pairwise comparisons against the original WT library. F. The cumulative frequency of WT reads mapping to elements with indicated genome copy numbers. G. Relative frequencies of various repeats in the WT library. Elements repeated >10 times per genome accounted for <20% of all reads. Simple repeats accounted for 85.714% and LINEs, SINEs, LTRs, low-complexity repeats, and satellites represented 4.881%, 4.130%, 2.636%, 2.487%, and 0.002%, respectively. H. Alignments of distinct WT pilot reads to the mouse X-chromosome. The number of reads per 100-kb window for both unique and repetitive elements are plotted from centromere (CEN) to distal telomere (TELO). 100-kilobase windows are nonoverlapping and consecutive. Reads were normalized such that those mapping to ‘n’ locations were counted as 1/nth of a read at each location. Chr, chromosome. Red, forward strand; green, reverse strand. I. Zoom-in of the X-inactivation center showing pilot WT reads. The Ezh2−/− library is depleted of these reads. Freq ≥3 reads shown. *, ncRNA.
Figure 2
Figure 2. Larger-scale sequencing to capture the PRC2 transcriptome
A. The scatterplot maps 39,003 transcripts from the UCSC joined transcriptome database by their RPKM values in the wildtype library (x-axis) and the null library (y-axis). A UCSC transcript that is neither represented in the WT or null library is plotted at (0,0). Smoothing was performed by the function, smoothScatter, in R. Darker shades correspond to a greater density of genes at a given point on the graph. The 3:1 WT/null enrichment line and the x=0.4 threshold are shown as dotted grey lines. Transcripts meeting the criteria of ≥3:1 RPKM enrichment and WT RPKM≥0.4 are deemed strong positives and are shown in red, in a pool marked “PRC2 transcriptome”. Transcripts that fall below the cut-offs are considered background and are shown in orange. Tsix is off-chart (arrow) with (x,y) coordinates indicated. B. Characteristics of the PRC2 transcriptome. Numbers in parentheses indicate the total number of genes in each category (e.g., Of 793 tumor suppressors, 325 are found in the PRC2 transcriptome). C. Higher resolution analysis of the X-inactivation center. Distinct reads were smoothed with a sliding 200-bp window on the x-axis and their representations plotted on the y-axis. D. Metagene analysis: distinct reads from the PRC2 transcriptome are plotted as a function of distance from TSS.
Figure 3
Figure 3. Hits to select imprinted loci
A,B. Read density plots for Nesp/Gnas (A) and Dlk1/Gtl2 (B) imprinted clusters. Distinct reads are smoothed with sliding consecutive 200-bp or 2-kb windows on the x-axis and their representations plotted on the y-axis. *, ncRNA. Chr, chromosome. Red, forward strand; green, reverse strand. The Ezh2−/− library is depleted of these reads.
Figure 4
Figure 4. Confirmation by native RIP/qRT-PCR and UV-crosslinked RIP
A. qRT-PCR to compare α-Ezh2 and IgG pulldowns. The experiments were performed 2–3 times in triplicate. Error bar = 1 standard deviation (SD). P was calculated using the two-tailed student t-test. Asterisks, undetectable levels. B. qRT-PCR after native α-Ezh2 RIP of wildtype and null ES cells, each normalized to IgG RIP values. Values for Xist, Gtl2-as, and Foxn2-as were off-chart. Experiments were performed 2–4 times in triplicate. 1 SD shown. P is calculated using the paired, two-tailed student t-test. Asterisks, undetectable RNA levels. C. Confirmation of native RIP by UV-crosslinked RIP. Each experiment was performed 2–4 times in triplicate, normalized to IgG pulldowns, and compared to that of Ezh2−/− controls using the t-test (P). 1 SD shown. D. Northern blot analysis of indicated RNA species. E. Native RIP with RNAse pretreatment, followed by qRT-PCR quantification.
Figure 5
Figure 5. Biochemical analysis shows direct interactions between RNA and PRC2
A. Coomassie-stained gel of human PRC2 and subunits. Different migrations reflect Flag-tagged versus untagged versions of each protein. B. WT and mutant (Mut) versions of RepA and Hes1-as double stem-loop structures. C. RNA EMSA using purified PRC2 complex and end-labeled probes. Negative controls: DsI and DsII, RNA sequences from Xist outside of RepA. Double shifts indicate presence of multiple subcomplexes of PRC2. D. RNA EMSA using purified PRC2 subunits. The lanes were run on the same gel but separated in the image because a lane was cut out between each panel. E. Titration of 1–25 fmoles of Hes1-as RNA probe against 0.1–1.0 μg of EZH2. F. RNA pulldown assays using purified PRC2 and indicated RNA probes loaded in equal moles. 25% of the IP fraction, 10% of flow-through, and 10% of RNA input are shown.
Figure 6
Figure 6. Gtl2 controls Dlk1 by targeting PRC2
A. Map of Dlk1-Gtl2 and the positions of shRNAs and primer pairs used in RIP and ChIP. Dotted lines indicate that the transcripts may extend further. B. qRT-PCR of Gtl2, Dlk1, and Gtl2-as RNA levels after Gtl2 knockdown (KD). Pools of knockdown cells are used. RNA levels are normalized to Gapdh levels and compared to levels in scrambled knockdown controls (Scr). Experiments were performed in triplicates two times. One SD shown. P is calculated using a two-tailed student t-test between Gtl2 versus Scr KDs. C. qChIP of PRC2 association in KD cells. ChIP was carried out with α-Ezh2 and α-H3K27me3 antibodies, with normal rabbit IgG as control (not shown). qPCR levels are expressed as a percentage of input DNA. DMR, differentially methylated region. ICR, imprint control region. One SD shown. P, determined by two-tailed student t-tests of Gtl2 versus Scr KD. D. qRT-PCR of Ezh2 mRNA levels in Gtl2- and Scr-KD clones. Averages and standard errors shown for two independent experiments. E. qRT-PCR of Dlk1 expression in Ezh2−/− versus WT cells relative to Gtl2 expression. One SD shown.

References

    1. Axelson H. The Notch signaling cascade in neuroblastoma: role of the basic helix-loop-helix proteins HASH-1 and HES-1. Cancer Lett. 2004;204:171–178. - PubMed
    1. Batzoglou S, Jaffe DB, Stanley K, Butler J, Gnerre S, Mauceli E, Berger B, Mesirov JP, Lander ES. ARACHNE: a whole-genome shotgun assembler. Genome Res. 2002;12:177–189. - PMC - PubMed
    1. Bernardi R, Pandolfi PP. Structure, dynamics and functions of promyelocytic leukaemia nuclear bodies. Nat Rev Mol Cell Biol. 2007;8:1006–1016. - PubMed
    1. Bernstein BE, Mikkelsen TS, Xie X, Kamal M, Huebert DJ, Cuff J, Fry B, Meissner A, Wernig M, Plath K, et al. A bivalent chromatin structure marks key developmental genes in embryonic stem cells. Cell. 2006a;125:315–326. - PubMed
    1. Bernstein E, Allis CD. RNA meets chromatin. Genes Dev. 2005;19:1635–1655. - PubMed

Publication types

MeSH terms