

TDP-43 subtypes are associated with distinct atrophy patterns in frontotemporal dementia
- PMID: 21172843
- PMCID: PMC3013589
- DOI: 10.1212/WNL.0b013e318202038c
TDP-43 subtypes are associated with distinct atrophy patterns in frontotemporal dementia
Abstract
Background: We sought to describe the antemortem clinical and neuroimaging features among patients with frontotemporal lobar degeneration with TDP-43 immunoreactive inclusions (FTLD-TDP).
Methods: Subjects were recruited from a consecutive series of patients with a primary neuropathologic diagnosis of FTLD-TDP and antemortem MRI. Twenty-eight patients met entry criteria: 9 with type 1, 5 with type 2, and 10 with type 3 FTLD-TDP. Four patients had too sparse FTLD-TDP pathology to be subtyped. Clinical, neuropsychological, and neuroimaging features of these cases were reviewed. Voxel-based morphometry was used to assess regional gray matter atrophy in relation to a group of 50 cognitively normal control subjects.
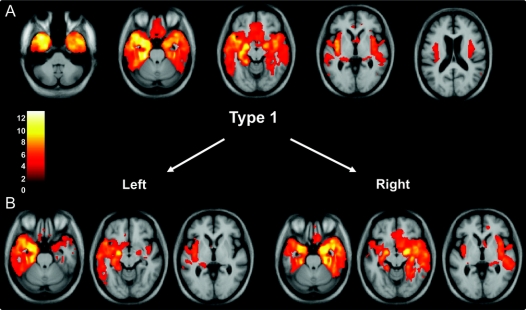
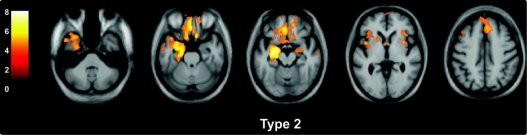
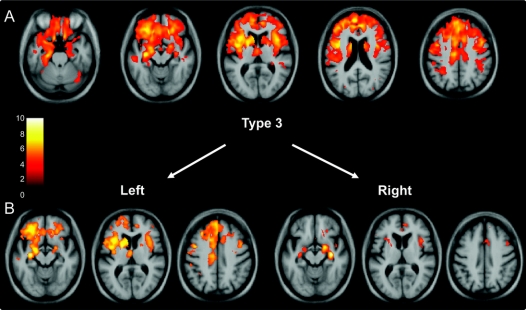
Results: Clinical diagnosis varied between the groups: semantic dementia was only associated with type 1 pathology, whereas progressive nonfluent aphasia and corticobasal syndrome were only associated with type 3. Behavioral variant frontotemporal dementia and frontotemporal dementia with motor neuron disease were seen in type 2 or type 3 pathology. The neuroimaging analysis revealed distinct patterns of atrophy between the pathologic subtypes: type 1 was associated with asymmetric anterior temporal lobe atrophy (either left- or right-predominant) with involvement also of the orbitofrontal lobes and insulae; type 2 with relatively symmetric atrophy of the medial temporal, medial prefrontal, and orbitofrontal-insular cortices; and type 3 with asymmetric atrophy (either left- or right-predominant) involving more dorsal areas including frontal, temporal, and inferior parietal cortices as well as striatum and thalamus. No significant atrophy was seen among patients with too sparse pathology to be subtyped.
Conclusions: FTLD-TDP subtypes have distinct clinical and neuroimaging features, highlighting the relevance of FTLD-TDP subtyping to clinicopathologic correlation.
Figures
References
-
- Snowden J, Neary D, Mann D. Frontotemporal lobar degeneration: clinical and pathological relationships. Acta Neuropathol 2007;114:31–38. - PubMed
-
- Dickson DW. Neuropathologic differentiation of progressive supranuclear palsy and corticobasal degeneration. J Neurol 1999;246(suppl 2):II6–II15. - PubMed
Publication types
MeSH terms
Substances
Grants and funding
- AG10124/AG/NIA NIH HHS/United States
- P50 AG23501/AG/NIA NIH HHS/United States
- UO1 AG029213-01/AG/NIA NIH HHS/United States
- 1 U01 AG 024904-05/AG/NIA NIH HHS/United States
- P01 AG019724/AG/NIA NIH HHS/United States
- P01 AG19724/AG/NIA NIH HHS/United States
- P50 NS053488-02/NS/NINDS NIH HHS/United States
- P30 AG 10124-18/AG/NIA NIH HHS/United States
- AG023501/AG/NIA NIH HHS/United States
- R01 AG033017/AG/NIA NIH HHS/United States
- RC2NS069368/NS/NINDS NIH HHS/United States
- P01 AG 09215-20/AG/NIA NIH HHS/United States
- WT_/Wellcome Trust/United Kingdom
- P30AG036468/AG/NIA NIH HHS/United States
- P01 AG 17586-10/AG/NIA NIH HHS/United States
- P50 AG023501/AG/NIA NIH HHS/United States
- RC1AG035427/AG/NIA NIH HHS/United States
- 1P01 AG-19724-07/AG/NIA NIH HHS/United States
- AG17586/AG/NIA NIH HHS/United States
LinkOut - more resources
Full Text Sources
Medical
Miscellaneous