. 2011 Feb 1;186(3):1598-607.
doi: 10.4049/jimmunol.1003304. Epub 2010 Dec 20.

CD4 T cells promote rather than control tuberculosis in the absence of PD-1-mediated inhibition

Affiliations

CD4 T cells promote rather than control tuberculosis in the absence of PD-1-mediated inhibition

Daniel L Barber et al. J Immunol. .

Abstract

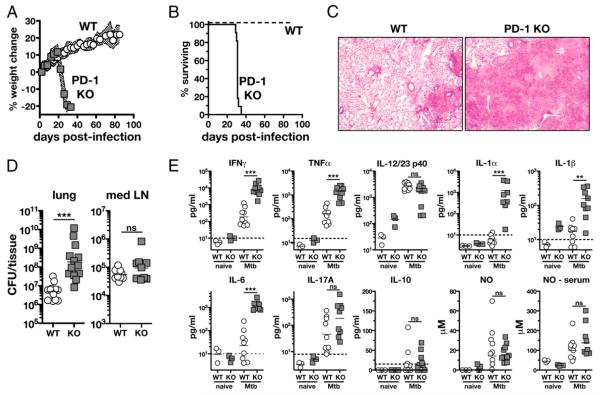
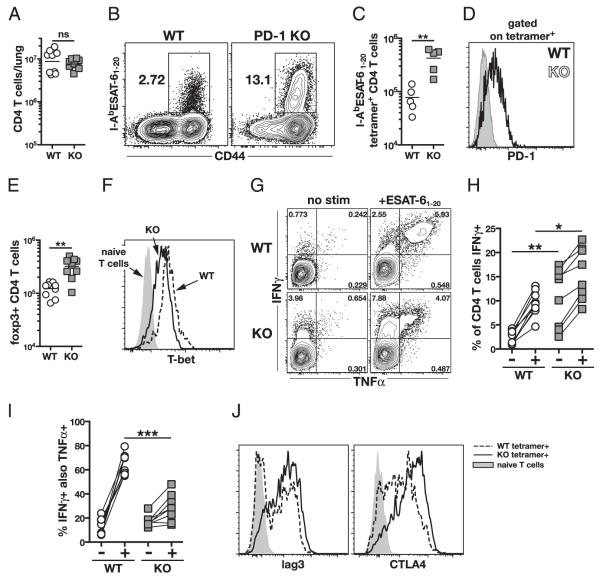
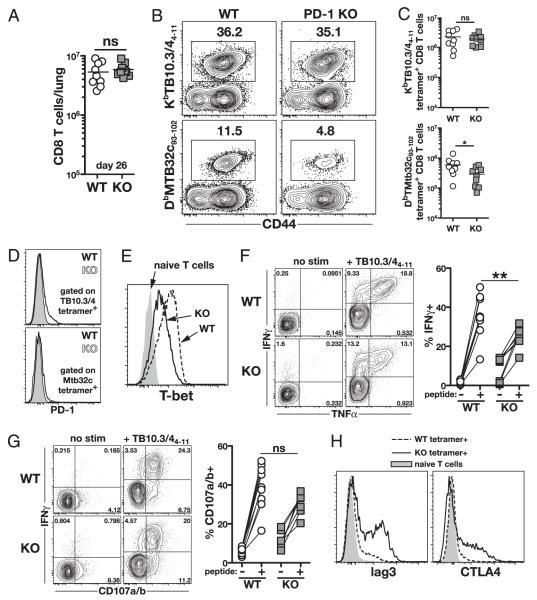
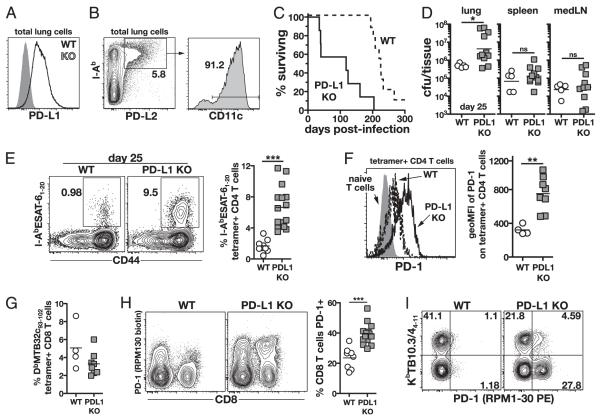
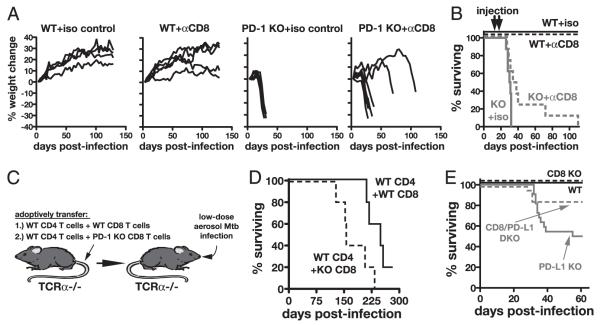
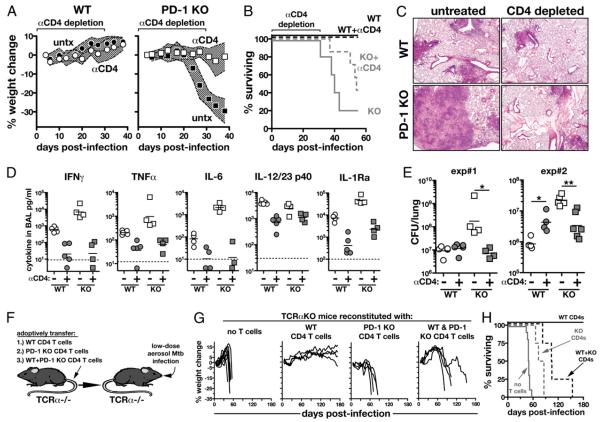
Although CD4 T cells are required for host resistance to Mycobacterium tuberculosis, they may also contribute to pathology. In this study, we examine the role of the inhibitory receptor PD-1 and its ligand PD-L1 during M. tuberculosis infection. After aerosol exposure, PD-1 knockout (KO) mice develop high numbers of M. tuberculosis-specific CD4 T cells but display markedly increased susceptibility to infection. Importantly, we show that CD4 T cells themselves drive the increased bacterial loads and pathology seen in infected PD-1 KO mice, and PD-1 deficiency in CD4 T cells is sufficient to trigger early mortality. PD-L1 KO mice also display enhanced albeit less severe susceptibility, indicating that T cells are regulated by multiple PD ligands during M. tuberculosis infection. M. tuberculosis-specific CD8 T cell responses were normal in PD-1 KO mice, and CD8 T cells only had a minor contribution to the exacerbated disease in the M. tuberculosis-infected PD-1 KO and PD-L1 KO mice. Thus, in the absence of the PD-1 pathway, M. tuberculosis benefits from CD4 T cell responses, and host resistance requires inhibition by PD-1 to prevent T cell-driven exacerbation of the infection.


Figures

FIGURE 1
FIGURE 1
PD-1 is required for control of M. tuberculosis infection. A and B, Weight loss (A) and survival (B) after low-dose aerosol infection with H37Rv. n = 15 WT and n = 11 PD-1 KO animals. Traveling error bars in A indicate the SD. C, H&E staining of lung sections on day 26 postinfection. Original magnification ×50. D, Bacterial loads in lung homogenates and mediastinal lymph nodes on day 26 postinfection. E, Cytokines were measured by ELISA and NO by nitrate reductase assay in the bronchoalveolar lavage fluid in naive WT and PD-1 KO mice and on day 26 of infection. NO is also shown in the serum. Data in D and E are pooled from two to three independent experiments.
FIGURE 2
FIGURE 2
M. tuberculosis-specific CD4 T cells in lung express PD-1 and are increased in PD-1 KO mice. A, Numbers of total CD4 T cells in the lungs on day 26 postinfection. Data are pooled from two independent experiments. B and C, Representative plots of IAbESAT-61–20 MHC class II tetramer staining of CD4 T cells in the lung on day 26 postinfection (B) and numbers of tetramer+ CD4 T cells in the lung (C). Data in B and C are representative of three independent experiments. D, PD-1 expression on IAbESAT-61–20 tetramer+ CD4 T cells from WT and PD-1 KO mice. E, Number of Foxp3+ CD4 T cells in the lungs on day 26. Data are pooled from two independent experiments. F, Representative histograms of T-bet expression on IAbESAT-61–20 tetramer+ CD4 T cells from WT and PD-1 KO mice on day 26 postinfection. G and H, Representative plots of IFN-γ and TNF-α staining on lung CD4 T cells after ESAT-61–20 peptide restimulation (G) and summary data pooled from two independent experiments (H). I, Percentage of IFN-γ–producing CD4 T cells that co-produced TNF-α. Data are pooled from two independent experiments. J, Lag3 and intracellular CTLA-4 expression by IAbESAT-61–20 tetramer+ lung CD4 T cells from WT and PD-1 KO mice.
FIGURE 3
FIGURE 3
Immunodominant M. tuberculosis-specific CD8 T cells express low levels of PD-1 and are not increased in PD-1 KO mice. A, Numbers of total CD8 T cells in the lungs on day 26 postinfection. Data are pooled from two independent experiments. B and C, Representative plots of KbTB10.3/44–11 and DbMtb32c93–102 MHC class I tetramer staining (B) and total numbers of tetramer+ CD8 T cells in the lungs of WT and PD-1 KO mice (C). Data in C are pooled from two independent experiments. D, PD-1 expression on KbTB10.3/44–11 and DbMtb32c93–102 tetramer+ CD8 T cells in the lungs of WT and PD-1 KO mice. E, T-bet expression in WT and PD-1 KO KbTB10.3/44–11 tetramer+ CD8 T cells. F, Representative plots and summary data for IFN-γ and TNF-α production by lung CD8 T cells after TB10.3/44–11 peptide restimulation. G, Costaining for surface CD107a/b expression (a surrogate for degranulation) and intracellular IFN-γ production by lung CD8 T cells after TB10.3/44–11 peptide restimulation. Pooled data in F and G are from two independent experiments. H, Lag3 and intracellular CTLA-4 expression by KbTB10.3/44–11 tetramer+ CD8 T cells in the lung on day 26 postinfection.
FIGURE 4
FIGURE 4
PD-L1 KO mice are susceptible to M. tuberculosis infection and display elevated M. tuberculosis-specific CD4 T cell responses. A, PD-L1 expression on total viable lung cells in WT and PD-L1 KO mice on day 25 postinfection. B, PD-L2 expression by I-Ab bright CD11c+ cells in the lung on day 28 postinfection. C, Survival of WT and PD-L1 KO mice after M. tuberculosis infection. p < 0.001. n = 9 WT and n = 7 PD-L1 KO mice. Data are representative of three independent experiments. D, Bacterial loads in lung, spleen, and mediastinal lymph nodes in WT and PD-L1 KO mice on day 25 postinfection. Data are pooled from two independent experiments. E, Representative plots and summary data of IAbESAT-61–20 MHC class II tetramer staining on lung CD4 T cells from WT and PD-L1 KO mice on day 25 postinfection. Data in summary graph are pooled from two independent experiments. F, PD-1 expression on tetramer+ CD4 T cells in the lung on day 25 postinfection. Data are representative of three independent experiments. G, DbMtb32c93–102-specific CD8 T cells in the lungs on day 25 postinfection. Data are representative of two independent experiments. H, PD-1 expression on lung CD8 T cells in WT and PD-L1 KO mice on day 25. Summary data are pooled from two independent experiments. I, Representative plots of costaining lung CD8 T cells for KbTB10.3/44–11 tetramers and PD-1. Data are representative of three experiments.
FIGURE 5
FIGURE 5
CD8 T cells play a minor role in the increased susceptibility of PD-1 KO mice to M. tuberculosis infection. A and B, Weight loss (A) and survival (B) of WT and PD-1 KO mice treated with CD8 T cell-depleting Abs on days 20 and 25 postinfection with M. tuberculosis. Data are representative of two independent experiments. C and D, TCRα KO mice were reconstituted with WT CD4 T cells and either WT CD8 T cells or PD-1 KO CD8 T cells and then infected with M. tuberculosis (C) and survival was monitored (D). p < 0.05. Data are representative of two independent experiments. E, Survival of M. tuberculosis-infected WT (n = 10), CD8 KO (n = 10), PD-L1 KO (n = 22), and PD-L1/CD8 double-KO (n = 18) mice.
FIGURE 6
FIGURE 6
CD4 T cells induce severe pathology and promote M. tuberculosis infection in the absence of PD-1. A and B, Weight loss (A) and survival (B) of WT and PD-1 KO mice treated with CD4-depleting Abs from day 0 to 30 postinfection with M. tuberculosis. Traveling error bars in A represent the SD. (n = 5 WT no treatment, n = 5 WT plus αCD4, n = 5 PD-1 KO no treatment, and n = 7 PD-1 KO plus αCD4.) C, H&E sections of lungs on day 30 postinfection. Original magnification ×50. D, Cytokines were measured in the BAL fluid on day 30 postinfection in untreated and CD4-depleted WT and PD-1 KO mice. Data are representative of two independent experiments. E, Bacterial loads in the lungs on day 30 of infection. F, TCRα KO mice were reconstituted with WT, PD-1 KO, or a mixture of WT and PD-1 KO CD4 T cells and then infected with M. tuberculosis. G and H, Weight loss (G) and survival (H) of mice shown in F. Data are representative of three independent experiments.

Similar articles

Cited by

References

    1. World Health Organization . Tuberculosis Fact Sheet. WHO; Geneva, Switzerland: 2010. Number 104.
    1. Jung YJ, Ryan L, LaCourse R, North RJ. Properties and protective value of the secondary versus primary T helper type 1 response to airborne Mycobacterium tuberculosis infection in mice. J. Exp. Med. 2005;201:1915–1924. - PMC - PubMed
    1. Gallegos AM, Pamer EG, Glickman MS. Delayed protection by ESAT-6-specific effector CD4+ T cells after airborne M. tuberculosis infection. J. Exp. Med. 2008;205:2359–2368. - PMC - PubMed
    1. Tischler AD, McKinney JD. Contrasting persistence strategies in Salmonella and Mycobacterium. Curr. Opin. Microbiol. 2010;13:93–99. - PMC - PubMed
    1. Flynn JL, Chan J. Immune evasion by Mycobacterium tuberculosis: living with the enemy. Curr. Opin. Immunol. 2003;15:450–455. - PubMed

Publication types

MeSH terms