. 2010 Dec 20;10(14):22.
doi: 10.1167/10.14.22.

Motion-induced blindness and microsaccades: cause and effect

Affiliations

Motion-induced blindness and microsaccades: cause and effect

Yoram S Bonneh et al. J Vis. .

Abstract

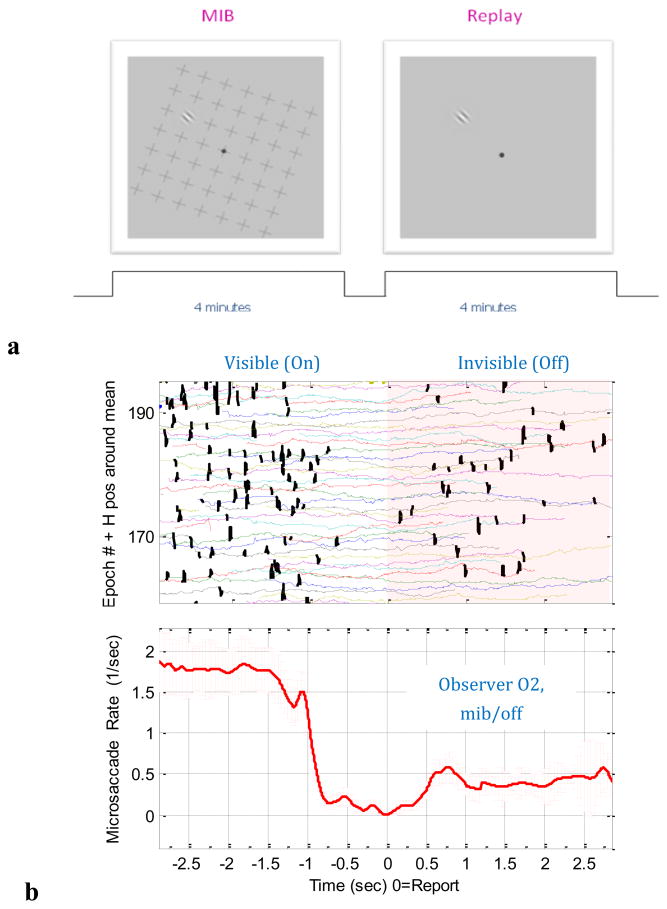
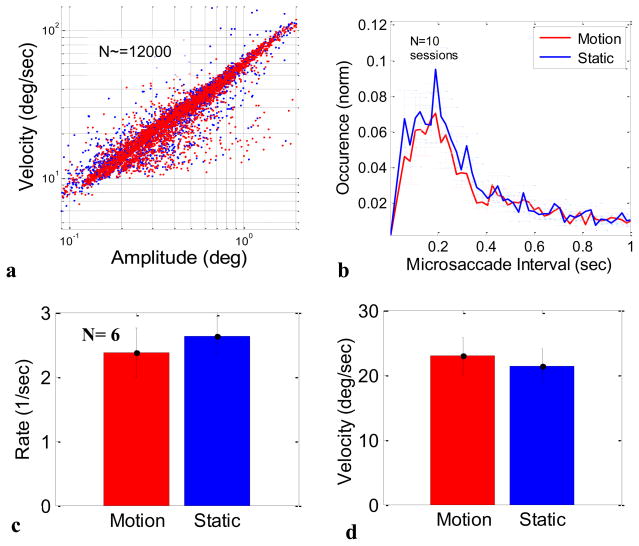
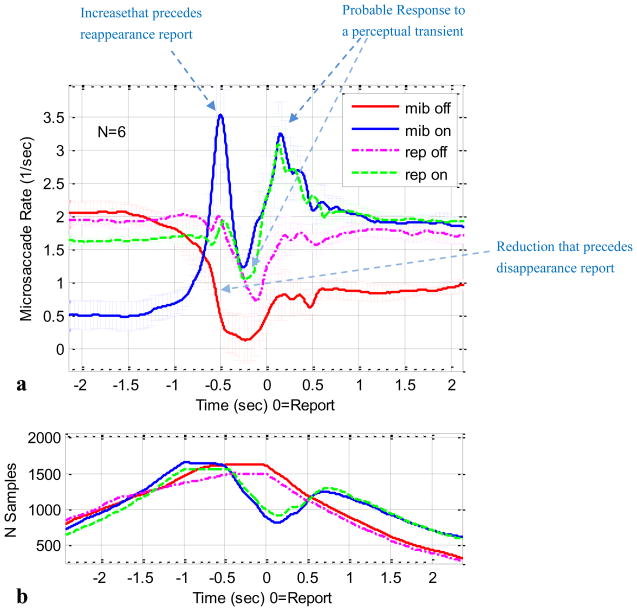
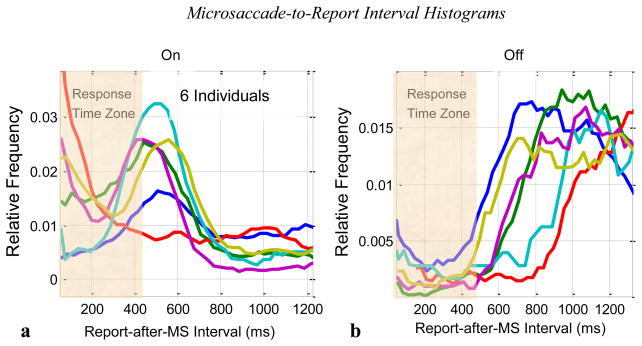
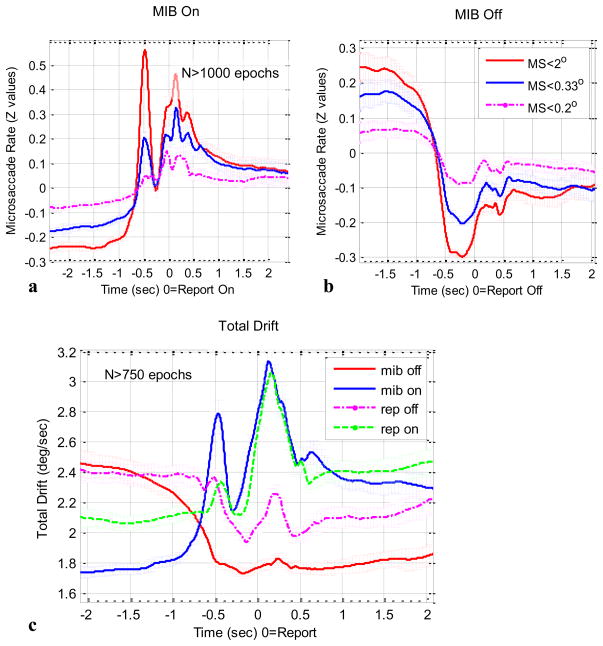
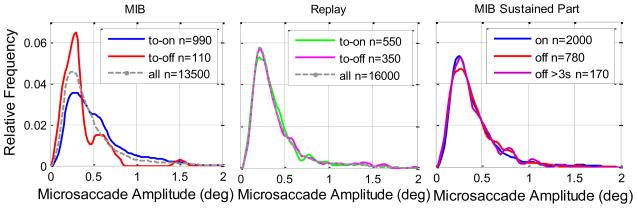
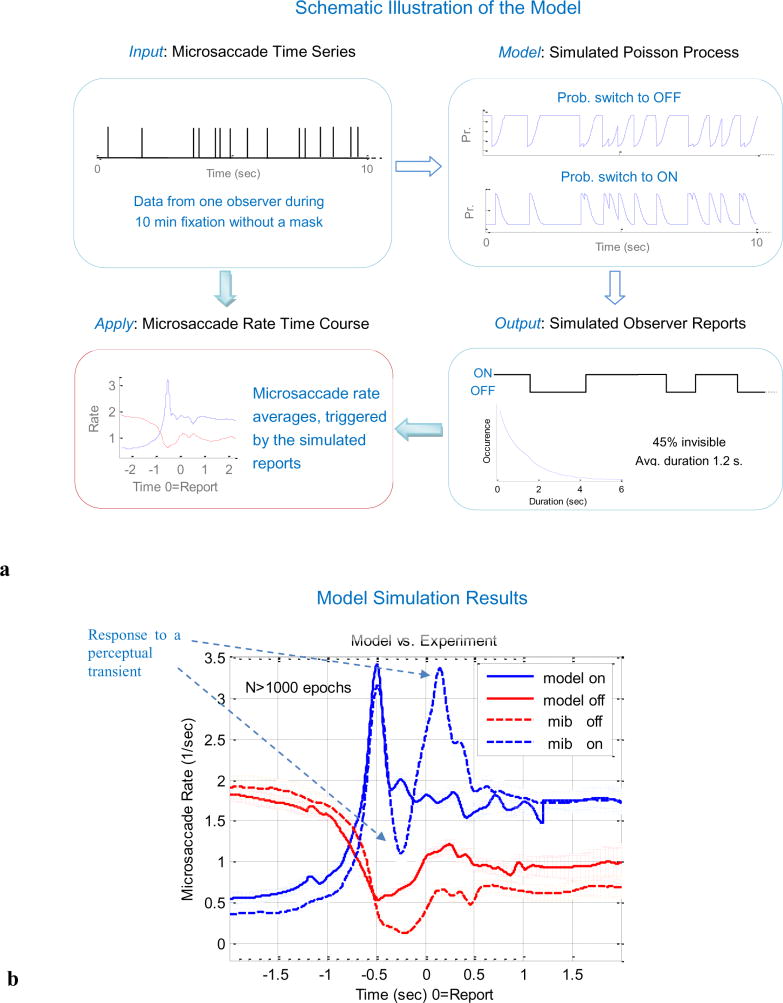
It has been suggested that subjective disappearance of visual stimuli results from a spontaneous reduction of microsaccade rate causing image stabilization, enhanced adaptation, and a consequent fading. In motion-induced blindness (MIB), salient visual targets disappear intermittently when surrounded by a moving pattern. We investigated whether changes in microsaccade rate can account for MIB. We first determined that the moving mask does not affect microsaccade metrics (rate, magnitude, and temporal distribution). We then compared the dynamics of microsaccades during reported illusory disappearance (MIB) and physical disappearance (Replay) of a salient peripheral target. We found large modulations of microsaccade rate following perceptual transitions, whether illusory (MIB) or real (Replay). For MIB, the rate also decreased prior to disappearance and increased prior to reappearance. Importantly, MIB persisted in the presence of microsaccades although sustained microsaccade rate was lower during invisible than visible periods. These results suggest that the microsaccade system reacts to changes in visibility, but microsaccades also modulate MIB. The latter modulation is well described by a Poisson model of the perceptual transitions assuming that the probability for reappearance and disappearance is modulated following a microsaccade. Our results show that microsaccades counteract disappearance but are neither necessary nor sufficient to account for MIB.


Figures

Figure 1
Figure 1
Experimental methods and data analysis.(a) Schematic illustration of MIB. In Experiment 2, observers viewed a 4 min MIB display (left) while reporting disappearance and reappearance with a button press. The observers then repeated the same task while viewing a 4 min “replay” of physical disappearance according to their previous reports. (b) Analysis of eye-tracking data illustrated by example from one observer in one condition. Data were first segmented into epochs, time locked to the perceptual reports of disappearance. Upper panel shows the pupil horizontal position around its mean per epoch, with microsaccades marked in bold (not all of 190 epochs are shown). Note the variable length epochs, each corresponding to periods with a single perceptual transition from visible (on the left) to invisible (on the right). Lower panel, shows the event-related microsaccade rate averaged across epochs. The event-related average is thus based on epochs with variable numbers of time points (n=151 on average).
Figure 2
Figure 2
The effect of motion on the rate and temporal distribution of microsaccades (Experiment 1). Observers viewed passively a rotating mask (“motion” condition) or a fixation point (“static” condition). (a) Maximal speed vs. amplitude of over 12,000 microsaccades measured for 6 observers. Red and blue dots correspond to microsaccades in the “motion” and “static” conditions respectively. The plot is used to validate the quality of microsaccade detection, showing the typical overlapping log-log linear relation for both conditions.(b) The distribution of inter-microsaccade intervals plotted as normalized occurrence histogram for the two conditions averaged across 10 mini-sessions (1–2 mini-sessions per observer for each of 6 observers). Error bars denote SEM (N = 10). Some observers showed fewer occurrences of short intervals in the motion condition, but this effect was not significant for the group. (c)and(d) Group averages of microsaccade rate (c) and microsaccade maximal velocity (d) for the two conditions. The microsaccade rate for the motion condition (2.37/s) was slightly lower than the rate for the static condition (2.62/s), though this difference was not statistically significant.
Figure 3
Figure 3
Eye movements during MIB and replay (Experiment 2).(a) Event-related modulations of microsaccade rate for each of the four conditions: MIB and Replay (rep), reappearance (on) and disappearance (off). Data were averaged across epochs within observer, normalized per observer and then averaged and rescaled by the group mean (results were similar when averaging across all epochs without normalization as well as when normalizing per epoch). The resulting event-related time-courses were smoothed beyond +/−1 s time range to emphasize the tonic differences (see Methods). Error bars, indicating SEM across observers, were down-sampled for clarity. All visible differences (without error bar overlap) between the curves were highly significant, except for the difference between “rep off” and “rep on” before report (see text for details). (b) The accumulated number of samples per data point (summed across observers) for the different conditions. The number decreases as a function of the time from the report because longer epochs were less frequent. The additional modulation around report for reappearance (on) reflects a tendency to blink about 0.5 s after reappearance.
Figure 4
Figure 4
The dependence of MIB reappearance and disappearance on the time interval since the preceding microsaccade. (a) Reappearance (“on”). (b) Disappearance (“off”). Intervals were obtained from all epochs of the MIB condition for each observer and were used to compute normalized histograms (dividing by the total count). Colors correspond to different observers. Shaded regions denote an interval equivalent to 450 ms (the approximate response time) prior to report. Note, however, that although report occurs with a delay of approximately 450 ms, disappearance (b) may occur a short time after a microsaccade for some observers (e.g., dark blue trace, within 400 ms) while for other observers the time interval can be as long as 700 ms (e.g., red curve). Note also that the reappearance report (a) occurs typically about 500 ms following a microsaccade (red is the only exception), which implies a high probability for occurrence immediately after a microsaccade assuming ~450 ms response time.
Figure 5
Figure 5
Comparison of methods for detecting and quantifying fixational eye movements (Experiment 2).(a)and(b) Event-related microsaccade rate time-courses were computed for three microsaccade amplitude limits: 2 deg (standard), 0.33 deg (20′) and 0.2 deg (12′). (a) Reappearance (“on”). (b) Disappearance (“off”). The baseline microsaccade rates are similar for all three, although the peak prior to reappearance is smaller with smaller amplitude limits. (c) An alternative quantification of the fixational eye movements via a measure of the total drift (or retinal slip), including microsaccades. This measure yielded similar results to those obtained with the event-related microsaccade rate analysis, but with a somewhat different weighting for the different effects. All visible effects are highly significant, including the tonic difference between Replay “on” and “off”. In all three plots, data were averaged per condition and event type across all epochs from all observers, yielding a variable number of samples per point. Error bars indicate SEM across epochs (N>750), down sampled for clarity.
Figure 6
Figure 6
Relation between microsaccade amplitude(displacement) and the perceptual state and transitions. Microsaccade amplitude histograms were compiled across observers for different time windows and conditions. (a) The amplitude of microsaccades in a time window of +/− 0.1 s around 0.5 s prior to report of either reappearance (blue, “on”) or disappearance (red, “off”) in comparison to the amplitude of microsaccades during the whole epoch period (dashed gray). Note the higher occurrence of larger microsaccades for reappearance (blue trace; smaller peak and longer tail) and shorter microsaccades for disappearance (red trace; larger peak and shorter tail). (b) The same for the Replay data showing no significant difference between the different transitions.(c) Comparison of the sustained states in MIB more than 1 s away from transition. There is no significant difference in microsaccade amplitude between the visible (blue, “on”) and invisible (red, “off”) conditions. Data selected for epochs longer than 3 s (purple, off > 3) demonstrate the occurrence of typical-size microsaccades well within the invisibility period.
Figure 7
Figure 7
A Poisson model of MIB that incorporates the effect of microsaccades on perceptual transitions. (a) a schematic illustration of the model. The model receives a time series of microsaccades collected during passive fixation without a mask (upper-left box). It simulates the perceptual transitions with a Poisson process whose probability parameter is altered by the onsets of microsaccades (upper-right box). A microsaccade is assumed to increase probability for a switch when the MIB target is invisible (upper-right box, bottom panel) and to decrease probability of a switch when it is visible (upper panel, different scale). This change in switch probability decays within 0.5 s following each microsaccade. The output of this process is a series of reports of a simulated observer that mimics human observers with a typical distribution of invisibility periods and durations (bottom-right box). The series of reports is then applied to the original microsaccade time series to produce the event-related microsaccade rate curves assuming 450 ms response times (bottom-left box).(b) Simulation results (solid curves) repeated several times to produce over 1000 epochs of each condition. Blue, reappearance (“on”). Red, disappearance (“off”). Error bars indicate SEM across simulated epochs. Dashed curves show the experimental results (similar to Figure 3, but averaged across all epochs of all observers) superimposed for comparison.

Similar articles

Cited by

References

    1. Benjamini Y, Yekutieli D. The control of the false discovery rate in multiple testing under dependency. Annals of Statistics. 2001;29(4):1165–1188.
    1. Blake R, Logothetis NK. Visual competition. Nat Rev Neurosci. 2002;3(1):13–21. - PubMed
    1. Bonneh YS, Cooperman A, Sagi D. Motion-induced blindness in normal observers. Nature. 2001;411(6839):798–801. - PubMed
    1. Collewijn H, Kowler E. The significance of microsaccades for vision and oculomotor control. J Vis. 2008;8(14):20, 21–21. - PMC - PubMed
    1. Cornsweet TN. Determination of the stimuli for involuntary drifts and saccadic eye movements. J Opt Soc Am. 1956;46(11):987–993. - PubMed

Publication types