. 2011 Apr;21(4):545-54.
doi: 10.1101/gr.111211.110. Epub 2010 Dec 20.

RNA sequencing reveals the role of splicing polymorphisms in regulating human gene expression

Affiliations

RNA sequencing reveals the role of splicing polymorphisms in regulating human gene expression

Emilie Lalonde et al. Genome Res. 2011 Apr.

Abstract

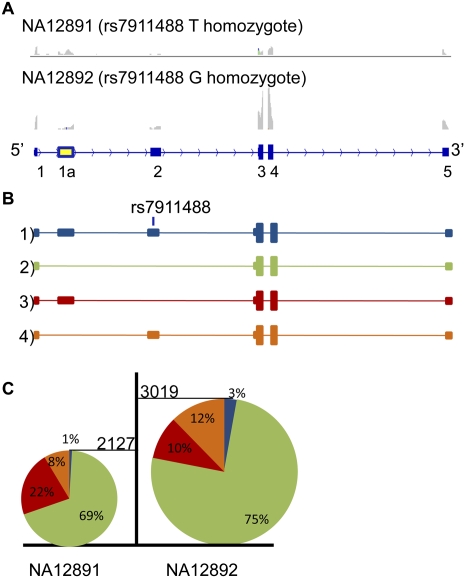
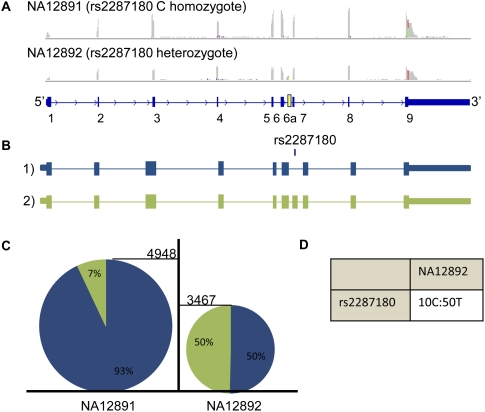
Expression levels of many human genes are under the genetic control of expression quantitative trait loci (eQTLs). Despite technological advances, the precise molecular mechanisms underlying most eQTLs remain elusive. Here, we use deep mRNA sequencing of two CEU individuals to investigate those mechanisms, with particular focus on the role of splicing control loci (sQTLs). We identify a large number of genes that are differentially spliced between the two samples and associate many of those differences with nearby single nucleotide polymorphisms (SNPs). Subsequently, we investigate the potential effect of splicing SNPs on eQTL control in general. We find a significant enrichment of alternative splicing (AS) events within a set of highly confident eQTL targets discovered in previous studies, suggesting a role of AS in regulating overall gene expression levels. Next, we demonstrate high correlation between the levels of mature (exonic) and unprocessed (intronic) RNA, implying that ∼75% of eQTL target variance can be explained by control at the level of transcription, but that the remaining 25% may be regulated co- or post-transcriptionally. We focus on eQTL targets with discordant mRNA and pre-mRNA expression patterns and use four examples: USMG5, MMAB, MRPL43, and OAS1, to dissect the exact downstream effects of the associated genetic variants.


Figures

Figure 1.
Figure 1.
Sequencing coverage as a function of the position across a transcript in NA12892. For all genes longer than 1000 nt and expressed above a nominal background (≥10 reads), the number of mapping reads at each position of the transcript is plotted against the distance to the transcript ends. Data points have been averaged within 10-nt bins.
Figure 2.
Figure 2.
Correlation between expression level differences of the top 500 eQTL targets predicted by an exon array study (Kwan et al. 2008) and our RNA sequencing study. Gene expression levels from RNA sequencing data were obtained by counting all the short sequencing reads mapping to the mRNA of each gene (exons and exon–exon junctions). Results were normalized and log2-transformed, and the log-ratios (fold changes [FC]) between NA12891 and NA12892 were used to measure the difference in gene expression between the two individuals. The Pearson correlation is shown as the R2 value.
Figure 3.
Figure 3.
Correlation between expression levels of exons and introns within the eQTL targets used in the study (see text). This correlation can be used to infer the number of eQTLs acting at the level of transcription versus the number of eQTLs acting co- or post-transcriptionally. The R2-value represents the Pearson correlation, and the y-value represents the slope of the regression line.
Figure 4.
Figure 4.
In USMG5, inclusion of exon 2 is associated with increased transcript expression, and inclusion of exon 1a is associated with decreased transcript expression. The reference T allele of rs791148 is associated with inclusion of exon 1a, and the alternate G allele is associated with inclusion of exon 2. (A) Screenshots taken from Integrated Genome Viewer (IGV) illustrating the read coverage of the two samples in USMG5. The Y-axis for both tracks is scaled to a maximum read count of 1150 (measured as number of reads mapping to a given nucleotide). (B) The different USMG5 isoforms observed. (C) The percentage of each isoform (color-coded as in B) observed in the allele-specific alignment for both individuals. The height of each pie chart is representative of the gene expression for USMG5 as measured by the number of reads mapping to the exonic and intronic regions of the gene. The number of isoforms present in each individual was deduced by counting the number of splice junction reads spanning a unique splice junction for each of the isoforms (junction 1a-2 for isoform 1; junction1-3 for isoform 2; junction 1a-3 for isoform 3; and junction 1-2 for isoform 4).
Figure 5.
Figure 5.
Correlation of SNP rs2287180 to overall MMAB transcript expression and to expression of MMAB novel exon 6a. (A) Screenshots taken from IGV illustrating the read coverage of MMAB. The maximum height for both tracks is set to 700. (B) The different MMAB isoforms seen in the alignment. (C) The percentage of transcripts (color-coded as in B) including and excluding exon 6a in NA12891 and NA12892. To measure the transcripts including exon 6a, the number of reads mapping to the junctions 6-6a and 6a-7 was averaged, and to measure the number of transcripts excluding exon 6a, the number of reads mapping to junction 6-7 were counted. The height of each pie chart is representative of the gene expression for MMAB. (D) The number of reads supporting the reference and alternate alleles for rs2287180, respectively, in individual NA12892.
Figure 6.
Figure 6.
OAS1 isoforms. (A) Screenshots from IGV displaying the read coverage within the OAS1 gene. The maximum height of both tracks is 2000. (B) All possible isoforms seen in OAS1 and their association with SNPs rs1131454, rs60623134, rs10774671, and rs1051042. Larger font indicates stronger allelic imbalance (not to scale), and if both alleles are shown, then there is no evidence for genetic control on isoform production by this SNP. Isoforms 1, 2, 3, and 4 differ only by exon 6: in isoform 1 it is the normal exon 6; in isoform 2 it is shifted by 1 bp (exon 6′); in isoform 3 it is shifted by 98 bp (exon 6″); and in isoform 4 it begins within the intron (exon 6″′). (C) Relative percentages of isoforms seen within individuals NA12891 and NA12892. The number of isoforms is inferred by the number of reads mapping to unique splice junctions for most isoforms (junction 5-6 for isoform 1; junction 5-6′ for isoform2; junction 5-6″ for isoform 3; junction 5 to 6″′ for isoform 4; junction 2-3′ for isoform 6). For isoform 5, expression was measured by the number of reads mapping 25 bp past the end of exon 5 (still within the extended exon). The height of each pie chart is representative of the gene expression for OAS1. There is a 1.9-fold increase in expression in favor of individual NA12892. (D) The number of reads supporting the reference and alternate alleles seen in individual NA12892.
Figure 7.
Figure 7.
Isoform eQTLs found in MRPL43. (A) Screenshots from IGV displaying the read coverage within MRPL43. The maximum height of both tracks is 370. (B) Various isoforms detected in MRPL43 and their allele specificity (if any) to SNP rs2863095. (C) Relative percentages of isoforms (color-coded as in B) seen within individuals NA12891 and NA12892. Expression of each isoform was measured by counting the number of reads mapping to a junction specific for most isoforms (junction 3-3a for isoform 2; junction 3′-3a for isoform 3; junction 3-4 for isoform 4; junction 5-7 for isoform 6). For isoform 1, the expression was estimated as the number of reads mapping 110 bp after exon 3, since it is the only isoform that should be expressed at this point. The expression of isoform 5 was deduced by subtracting the number of reads supporting isoform 6 from the number of reads spanning junction 3-4, since they are the two isoforms using this splice junction. The height of each pie chart is representative of the gene expression for MRPL43. (D) Ratio of reference to alternate alleles seen in individual NA12892.

References

    1. Andrés AM, Dennis MY, Kretzschmar WW, Cannons JL, Lee-Lin SQ, Hurle B, NISC Comparative Sequencing Program, Schwartzberg PL, Williamson SH, Bustamante CD, et al. 2010. Balancing selection maintains a form of ERAP2 that undergoes nonsense-mediated decay and affects antigen presentation. PLoS Genet 6: e1001157 doi: 10.1371/journal.pgen.1001157 - PMC - PubMed
    1. Bemmo A, Benovoy D, Kwan T, Gaffney DJ, Jensen RV, Majewski J 2008. Gene expression and isoform variation analysis using Affymetrix Exon Arrays. BMC Genomics 9: 529 doi: 10.1186/1471-2164-9-529 - PMC - PubMed
    1. Benovoy D, Kwan T, Majewski J 2008. Effect of polymorphisms within probe-target sequences on olignonucleotide microarray experiments. Nucleic Acids Res 36: 4417–4423 - PMC - PubMed
    1. Bonnevie-Nielsen V, Field LL, Lu S, Zheng DJ, Li M, Martensen PM, Nielsen TB, Beck-Nielsen H, Lau YL, Pociot F 2005. Variation in antiviral 2′,5′-oligoadenylate synthetase (2′5′AS) enzyme activity is controlled by a single-nucleotide polymorphism at a splice-acceptor site in the OAS1 gene. Am J Hum Genet 76: 623–633 - PMC - PubMed
    1. Bullaughey K, Chavarria CI, Coop G, Gilad Y 2009. Expression quantitative trait loci detected in cell lines are often present in primary tissues. Hum Mol Genet 18: 4296–4303 - PMC - PubMed

Publication types

MeSH terms

Substances