. 2011 Feb 1;589(Pt 3):697-710.
doi: 10.1113/jphysiol.2010.201129. Epub 2010 Dec 20.

A functional role for the 'fibroblast-like cells' in gastrointestinal smooth muscles

Affiliations

A functional role for the 'fibroblast-like cells' in gastrointestinal smooth muscles

Masaaki Kurahashi et al. J Physiol. .

Abstract

Smooth muscles, as in the gastrointestinal tract, are composed of several types of cells. Gastrointestinal muscles contain smooth muscle cells, enteric neurons, glial cells, immune cells, and various classes of interstitial cells. One type of interstitial cell, referred to as 'fibroblast-like cells' by morphologists, are common, but their function is unknown. These cells are found near the terminals of enteric motor neurons, suggesting they could have a role in generating neural responses that help control gastrointestinal movements. We used a novel mouse with bright green fluorescent protein expressed specifically in the fibroblast-like cells to help us identify these cells in the mixture of cells obtained when whole muscles are dispersed with enzymes. We isolated these cells and found they respond to a major class of inhibitory neurotransmitters - purines. We characterized these responses, and our results provide a new hypothesis about the role of fibroblast-like cells in smooth muscle tissues.


Figures
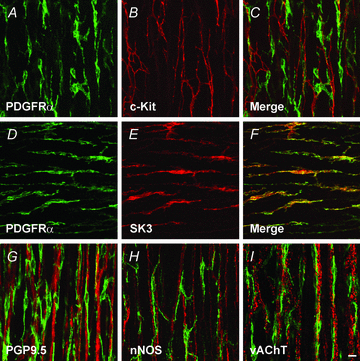
Figure 1
Figure 1. Relation of PDGFRα+ cells to ICC and enteric neurons
A–C, double immuno-labelling of PDGFRα (green) and c-Kit (red) in circular muscle layer of murine colon. Similar anatomical spaces were occupied by PDGFRα+ cells and c-Kit+, but no co-labelling of cells was observed demonstrating that these are discrete populations of cells. D–F, double immuno-labelling of PDGFRα (green) and SK3 (red) in longitudinal muscle layer of murine colon. PDGFRα+ cells express small conductance Ca2+-activated K channels (SK3; Iino & Nojyo, 2009). PDGFRα+ cells in both muscle layers and in the region of the myenteric plexus express SK3. G–I, double immuno-labelling of neuronal proteins (red) and PDGFRα (green) in circular muscle layer of murine colon. Red staining in G, H and I shows immunoreactivity for PGP9.5, nNOS and vesicular acetylcholine transporter (vAChT), respectively. PDGFRα+ cells are closely associated with enteric neurons (PGP9.5) and with specific classes of motor neurons (inhibitory as identified with nNOS antibody and excitatory as identified by vAChT antibody). White bar is 10 μm.
Figure 2
Figure 2. eGFP specifically labels PDGFRα+ cells
A–C, eGFP (green) and PDGFRα-like immunoreactivity (red) co-expressed in PDGFRα+-MY (A), circular muscle PDGFRα+-IM (B) and longitudinal muscle PDGFRα+-IM (C). eGFP is confined to nuclei while PDGFRα is more generally expressed in the plasma membranes. D–F, eGFP (D) and PDGFRα (E) are shown in cells dispersed from the colon. Small round nuclei of PDGFRα+ cells contained eGFP (F). G and H, the same cell is shown with differential interference contrast (DIC) microscopy. PDGFRα+ cell (arrow head) and a smooth muscle cell (arrow), respectively, were easy to distinguish and smooth muscle cells lacked eGFP expression. White bars and black bar are 10 μm. I and J, expression of molecular targets for purinergic neurotransmission in sorted PDGFRα+ cells. Expression analysis was performed by RT-PCR (I) and by real-time PCR analysis (J) on a highly purified population of PDGFRα+ cells (see Methods). These cells were not contaminated with Kit-expressing cells (I). PDGFRα+ cells also expressed P2ry1 (P2Y1 receptors) and Kcnn3 (SK3 channels). J shows relative expression of Pdgfra, Kit, P2ry1 and Kcnn3 as determined by real-time PCR. White bars represent PDGFRα+ cells and black bars represent whole colon muscle. Note robust expression of P2ry1 and Kcnn3 in the PDGFRα+ cells. Hprt is the house-keeping gene, hypoxanthine guanine phosphoribosyl transferase; NTC, non-template control.
Figure 3
Figure 3. Ca2+-activated K+ currents in PDGFRα+ cells
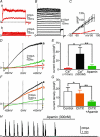
A and B, PDGFRα+ cells were depolarized with step potentials from a holding potential of −80 mV with low Ca2+ (<10 nm) pipette solution 1 (A) or 500 nm Ca2+ pipette solution 2 (B). Aa, currents evoked by 800 ms steps to 0 mV (lower trace) and +40 mV (upper trace) in a cell with low Ca2+ (<10 nm; solution 1). Depolarization elicited small time-dependent currents and a noisy current at more positive potentials. Ab shows a family of currents evoked by 800 ms steps from −80 mV to +70 mV in 10 mV increments in a cell with low Ca2+ (<10 nm; solution 1). At the end of step depolarizations, potential was returned briefly to −40 mV before stepping back to the holding potential. Small time-dependent outward currents were evoked at potentials positive to −20 mV. B, currents evoked by steps from −80 mV to +70 mV (800 ms in 10 mV increments) in cells with 500 nm Ca2+ (solution 2). Large amplitude, time-independent outward currents developed in cells with increased [Ca2+]i. C, summary of current density as a function of test potential in cells with low Ca2+ (red line, n= 4) and 500 nm Ca2+ pipette solutions (black line, n= 4). D, ramp protocols (−80 to +80 mV, rate-of-rise = 0.17 mV ms−1) were applied to PDGFRα+ cells in whole cell configuration with pipette solutions containing: 500 nm Ca2+ (a), 500 nm Ca2+ after apamin (300 nm) (b), and low Ca2+ (<10 nm) (c). Cells with 500 nm Ca2+ solution developed large, apamin-sensitive outward currents. Currents were due to a K+ conductance as apparent from leftward shift in reversal potential. Note inward rectification common to SK3 currents due to block by internal Mg2+ at depolarized potentials (Ledoux et al. 2008). Apamin reduced the outward current activated by high Ca2+ (b). With low Ca2+ (c) small amplitude linear currents were evoked in PDGFRα+ cells. E, average current density at 0 mV in cells with low Ca2+ (red bar; 3.1 ± 2.6 pA pF−1, n= 16), 500 nm Ca2+ (black bar, 43 ± 22 pA pF−1, n= 6), and 500 nm Ca2+ and apamin (green bar, 9 ± 5.6 pA pF−1, n= 6). 500 nm Ca2+ activated significant outward current (*P= 0.0015), and apamin (300 nm) reduced the current significantly (**P < 0.0001). F, responses to voltage ramps (−80 to +80 mV, 0.17 mV ms−1) in a cell dialysed with 500 nm Ca2+ (a). The cell was then exposed serially to charybdotoxin (ChTX; 200 nm; orange trace, b) and ChTX with apamin (300 nm; green trace, c). G, average current density at 0 mV under control conditions (500 nm Ca2+; black bar; 16.6 ± 4.6 pA pF−1, n= 6), ChTX (orange bar, 14.3 ± 3.9 pA pF−1, n= 6), and ChTX and apamin (green bar, 5.2 ± 1.3 pA pF−1, n= 6). ChTX reduced current (*P= 0.0488), with greater reduction at positive potentials, little effect at negative potentials, and little or no change in reversal potential. Apamin added with ChTX further reduced current (**P= 0.0406) and shifted reversal potential in the positive direction. H, some PDGFRα+ cells generated STOCs with average amplitude of 42 ± 13.8 pA pF−1 and frequency of STOC complexes of 3.2 ± 0.8 min−1. Cells were dialysed with low Ca2+ (solution 1) in these experiments; actual frequency of cells that generate STOCs could be much higher with physiological Ca2+ concentrations. Apamin (300 nm) blocked STOCs completely (n= 4).
Figure 4
Figure 4. Ca2+-dependent single channels in PDGFRα+ cells
A, in symmetrical KCl (140 mm), excised inside-out (i-o) patches displayed single channel activity. The bath solution contained 100 nm Ca2+. An expanded trace is shown at −60 mV to display channel openings. Closed (c) and open (o) states are denoted. Amplitude histograms (not shown) were constructed at various potentials and fitted amplitudes were plotted in B against test potentials. Linear fits yielded a single channel conductance of 10 pS. C, in symmetrical KCl i-o patches were ramped from −80 to 80 mV from a holding potential of −60 mV. [Ca2+] in the bath solution (intracellular surface of patch) was changed from 10−8 to 10−5m. D, calcium dose–response curve for current responses to ramped potentials in i-o patches. Currents at −60 mV were normalized to maximal current. Data were fitted with Boltzmann function and EC50 from 4 experiments averaged 364 ± 51 nm.
Figure 5
Figure 5. Activation of outward current by purines in PDGFRα+ cells
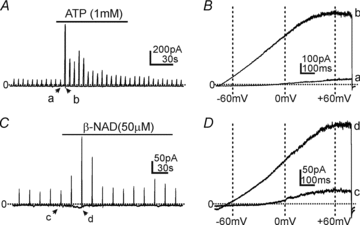
A–D, ramped potentials (−80 to +80 mV, 0.17 mV ms−1) were applied to PDGFRα+ cells in the whole cell configuration (cells dialysed with solution 1). ATP (1 mm) and β-NAD (50 μm) (bars in A and C, respectively) elicited large outward currents (ATP elicited current density; 82 ± 26.9 pA pF−1, n= 16, β-NAD elicited current density; 129 ± 101 pA pF−1, n= 3). Responses to single voltage ramps (denoted as a and b or c and d; before and in the presence of the purine, respectively) are shown in B and D. The outward currents activated immediately upon application of the purines but deactivated in spite of continued exposure to ATP or β-NAD.
Figure 6
Figure 6. Effects of ATP were concentration dependent and repeatable
A, brief exposures (20 s) to ATP (0.1 μm, 1 μm, 10 μm and 1 mm) at a holding potential of −50 mV (approximate resting potential of murine colonic muscles) caused large outward currents, resolved at 0.1 μm and nearly maximal at 10 μm. B, ATP concentration vs. current response in 6 cells. The X-axis is the log of ATP concentration (m), and the Y-axis is the integral of ATP response current (area under the curve; AUC) normalized to the maximum response integral. Data were fitted with a Boltzmann function and EC50 was calculated to be 1.96 μm (Hill slope = 1.19). Averaged AUC at maximal ATP concentration (1 mm) was 55.19 ± 33.1 pA min (n= 6). C and D, outward currents elicited in a PDGFRα+ cell by alternating exposures to ATP (10 μm) and ADP (10 μm). ATP and ADP had similar effects and repetitive application yielded reproducible responses. Note responses were often STOC-like and often extended past the period of exposure. D, averaged current responses to ATP and ADP in 7 cells. There were no significant difference in maximum current elicited by either ATP and ADP (ATP = 47.8 ± 20.0 pA pF−1 and ADP = 47.8 ± 20.3 pA pF−1; P= 0.4337) or in integrated current responses (ATP = 165.9 ± 82.7 pA min and ADP = 133.5 ± 60.1 pA min; P= 0.6416; n= 7).
Figure 7
Figure 7. Blockade of ATP responses by SK channel blocker and P2Y1 antagonist
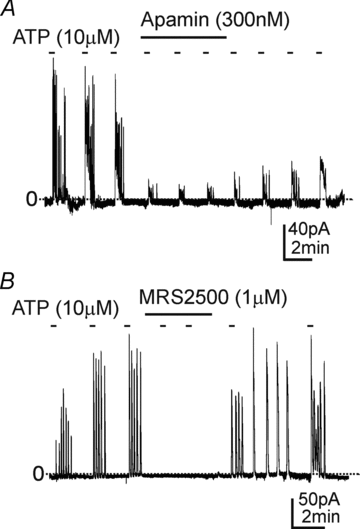
A, brief exposures (20 s) to ATP (10 μm) elicited reproducible large outward currents in PDGFRα+ cells (average 26.0 ± 5.8 pA pF−1, n= 6) that were reduced by apamin (300 nm) (7.8 ± 6.1 pA pF−1, n= 6; P= 0.0008). B, MRS2500 (1 μm) blocked outward currents elicited by ATP (control ATP response 37.5 ± 19.2 pA pF−1; after MRS2500 1.0 ± 1.0 pA pF−1, n= 8; P < 0.0001).
Figure 8
Figure 8. Currents activated by ATP were Ca2+ dependent
ATP (10 μm) responses were evoked by repetitive exposures in CaPSS bath solution. Switching the external solution to MnPSS (black bar), completely replacing extracellular Ca2+, progressively blocked ATP responses (e.g. average outward current in CaPSS: 37.2 ± 10.4 pA pF−1; after switching to MnPSS: 0.67 ± 0.72 pA, n= 5; P= 0.0213). ATP evoked currents were slowly restored after replacement of CaPSS.
Figure 9
Figure 9. Responses of smooth muscle cells to ATP
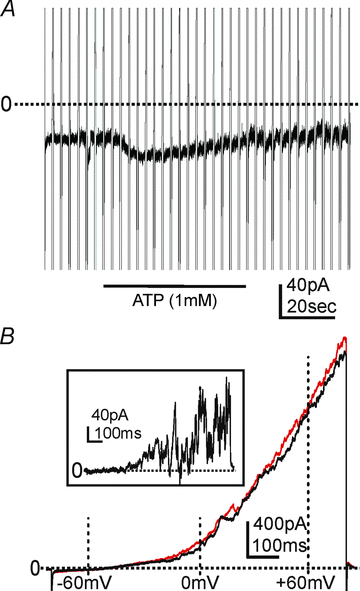
ATP (1 mm) produced very small current responses in smooth muscle cells. A and B, ramp protocols (−80 to +80 mV, 0.17 mV ms−1) were applied to smooth muscle cells in perforated patch whole-cell configuration. A, ATP elicited small inward currents in some cells (A), and small outward currents were evoked in other cells. B, responses to ramps before (black) and in the presence of ATP (1 mm; red). Inset shows a difference current from subtracting current responses. Small outward currents were evoked at positive potentials, but outward current at −50 mV was unresolvable.

Comment in

References

    1. Banks BE, Brown C, Burgess GM, Burnstock G, Claret M, Cocks TM, Jenkinson DH. Apamin blocks certain neurotransmitter-induced increases in potassium permeability. Nature. 1979;282:415–417. - PubMed
    1. Barfod ET, Moore AL, Lidofsky SD. Cloning and functional expression of a liver isoform of the small conductance Ca2+-activated K+ channel SK3. Am J Physiol Cell Physiol. 2001;280:C836–C842. - PubMed
    1. Bayguinov O, Hagen B, Bonev AD, Nelson MT, Sanders KM. Intracellular calcium events activated by ATP in murine colonic myocytes. Am J Physiol Cell Physiol. 2000;279:C126–C135. - PubMed
    1. Bayliss WM, Starling EH. The movements and innervation of the small intestine. J Physiol. 1899;24:99–143. - PMC - PubMed
    1. Blatz AL, Magleby KL. Single apamin-blocked Ca-activated K+ channels of small conductance in cultured rat skeletal muscle. Nature. 1986;323:718–720. - PubMed

Publication types

MeSH terms

Substances