. 2010 Dec 27;191(7):1239-49.
doi: 10.1083/jcb.201006076. Epub 2010 Dec 20.

A computational model predicts Xenopus meiotic spindle organization

Affiliations

A computational model predicts Xenopus meiotic spindle organization

Rose Loughlin et al. J Cell Biol. .

Abstract

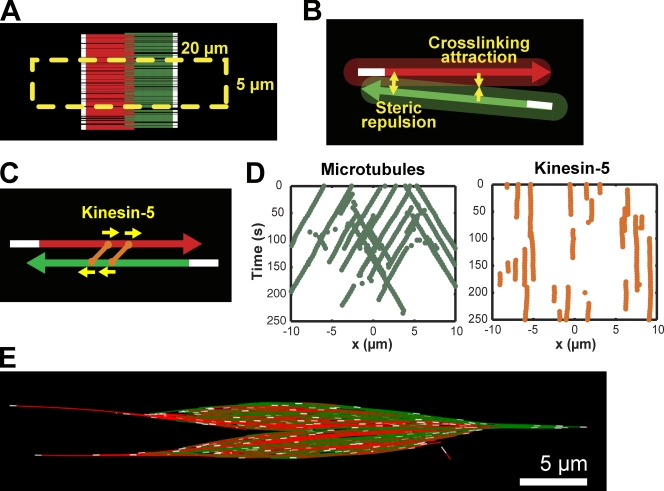
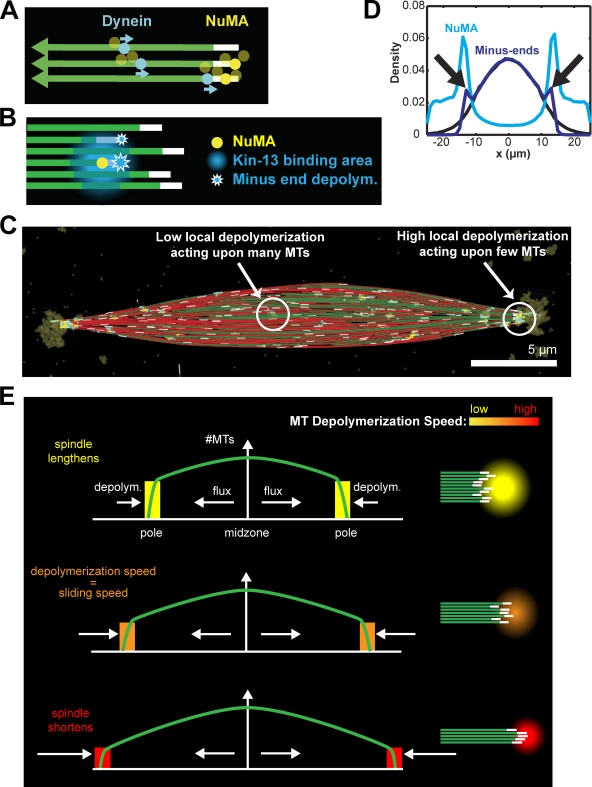
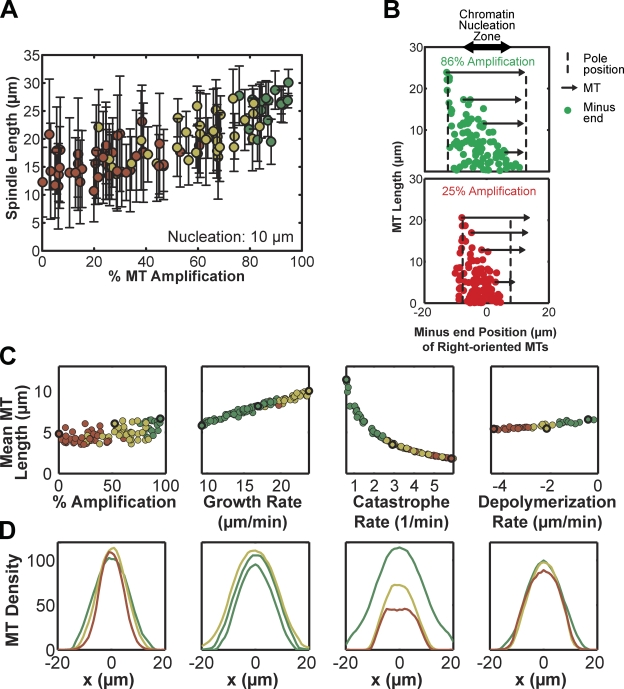
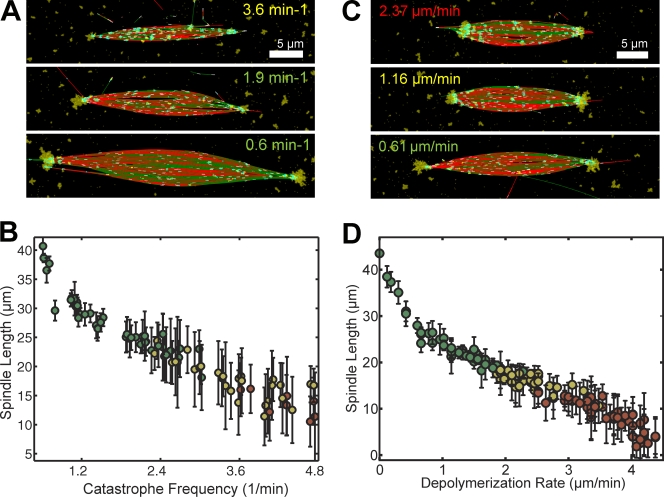
The metaphase spindle is a dynamic bipolar structure crucial for proper chromosome segregation, but how microtubules (MTs) are organized within the bipolar architecture remains controversial. To explore MT organization along the pole-to-pole axis, we simulated meiotic spindle assembly in two dimensions using dynamic MTs, a MT cross-linking force, and a kinesin-5-like motor. The bipolar structures that form consist of antiparallel fluxing MTs, but spindle pole formation requires the addition of a NuMA-like minus-end cross-linker and directed transport of MT depolymerization activity toward minus ends. Dynamic instability and minus-end depolymerization generate realistic MT lifetimes and a truncated exponential MT length distribution. Keeping the number of MTs in the simulation constant, we explored the influence of two different MT nucleation pathways on spindle organization. When nucleation occurs throughout the spindle, the simulation quantitatively reproduces features of meiotic spindles assembled in Xenopus egg extracts.


Figures

Figure 1.
Figure 1.
Self-assembly of a fluxing bipolar MT array with dynamic MTs and kinesin-5. (A) Simulations were initiated with MTs in an antiparallel array centered in the zone of high RanGTP concentration (yellow dashed line). MT color indicates orientation (MTs with plus-ends pointed to the right in red, to the left in green) and region (minus-end region in white). (B) MTs experience repulsion at close range (0–50 nm) and attraction between 50 and 90 nm. The shaded area represents the interaction zone. (C) Homotetrameric kinesin-5 (orange) are simple plus end–directed motors, and slide apart antiparallel MTs. (D) Kymograph of selected MT minus-ends (green) and kinesin-5 motors (orange) shows that kinesin-5 remains stationary while bound MTs slide poleward. (E) Bipolar MT structure formed by MTs, cross-linking force, and kinesin-5. Single MTs extend far from the midzone, and poles are not defined.
Figure 2.
Figure 2.
Depolymerization recruited by dynein-transported NuMA generates spindle poles. (A) NuMA (yellow) is transported to MT minus-ends by dynein (cyan). Oligomerization of NuMA leads to its accumulation at the spindle poles. (B) NuMA (yellow) recruits kinesin-13, whose binding (blue gradient) is spread among adjacent MTs. However, depolymerization (blue stars) only occurs at minus ends. Depolymerization is proportional to the amount of NuMA and inversely proportional to the local MT density (see Materials and methods). (C) Steady-state spindle structure with oligomerized NuMA (yellow) delivered to the pole by dynein (cyan). In the midzone, small amounts of kinesin-13 activity produce only slow depolymerization of minus ends. At the poles, accumulated NuMA recruits a large amount depolymerization activity distributed over few MTs, resulting in high depolymerization rates. (D) Minus-end density shows no polar accumulation (black) unless kinesin-13 depolymerization is added to the model (dark blue). With depolymerization, NuMA (light blue) accumulates at spindle poles (black arrows; average of 100, 95 simulations). (E) Schematic of metaphase steady state. MT density decreases from the midzone to the pole (green). Because depolymerization activity is spread over MTs, the depolymerization rate per MT increases with the distance from the midzone.
Figure 3.
Figure 3.
Spindle assembly is sensitive to mechanisms affecting internal MT organization but not to MT length distribution. (A) When the area of chromatin-mediated nucleation was decreased to span 10 µm, the bipolarity (green, yellow, and red) of MT structures was sensitive to the nucleation pathway. Color indicates MT ”bipolarity index” defined in Materials and methods: astral (red), bipolar (yellow), strongly bipolar (green). MT structures remained bipolar only for percentages of chromatin-mediated nucleation up to 25%, while spindle length in the bipolar regime scaled slightly with nucleation pathway (92 simulations). (B) Position of the minus ends of right-oriented MTs at a single time point with a 10-µm zone of chromatin-mediated MT nucleation (double arrow). In a simulation with 86% MT amplification (green), the bipolar MT structure contained short MTs throughout while long MTs were positioned with their minus ends at the pole (dashed lines). Four sample MTs are illustrated (arrows). In a simulation with only 25% MT amplification (red), the astral MT structure also contained small MTs throughout, but minus ends did not extend far from the midzone, and plus ends grew past minus ends. (C) Mean MT length and bipolarity index (color) for simulations in which parameters for the nucleation pathway, MT plus-end growth rate, MT plus-end catastrophe rate, and kinesin-13 rate were varied. Bold circles indicate the simulations represented in D (92, 99, 95, 99 simulations). (D) Total MT density along the pole-to-pole axis from representative simulations (bold circles in C), where color indicates bipolarity index. Spindles could form and fail in a variety of sizes, indicating a strong dependence for bipolarity on assembly mechanism rather than the exact organization of the MT structure.
Figure 4.
Figure 4.
Length of simulated spindles scales with catastrophe rate and minus-end depolymerization activity. (A and B) Range of steady-state spindle structures obtained with different MT plus-end catastrophe frequencies (mean ± SD, 95 simulations). (C and D) Range of steady-state spindle structures obtained with different MT minus-end depolymerization rates (mean ± SD, 126 simulations). In A–D, the text or symbol color designates bipolarity index: astral (red), bipolar (yellow), strongly bipolar (green).

Similar articles

Cited by

References

    1. Athale C.A., Dinarina A., Mora-Coral M., Pugieux C., Nedelec F., Karsenti E. 2008. Regulation of microtubule dynamics by reaction cascades around chromosomes. Science. 322:1243–1247 10.1126/science.1161820 - DOI - PubMed
    1. Badoual M., Jülicher F., Prost J. 2002. Bidirectional cooperative motion of molecular motors. Proc. Natl. Acad. Sci. USA. 99:6696–6701 10.1073/pnas.102692399 - DOI - PMC - PubMed
    1. Brown K.S., Blower M.D., Maresca T.J., Grammer T.C., Harland R.M., Heald R. 2007. Xenopus tropicalis egg extracts provide insight into scaling of the mitotic spindle. J. Cell Biol. 176:765–770 10.1083/jcb.200610043 - DOI - PMC - PubMed
    1. Budde P.P., Kumagai A., Dunphy W.G., Heald R. 2001. Regulation of Op18 during spindle assembly in Xenopus egg extracts. J. Cell Biol. 153:149–158 10.1083/jcb.153.1.149 - DOI - PMC - PubMed
    1. Burbank K.S., Groen A.C., Perlman Z.E., Fisher D.S., Mitchison T.J. 2006. A new method reveals microtubule minus ends throughout the meiotic spindle. J. Cell Biol. 175:369–375 10.1083/jcb.200511112 - DOI - PMC - PubMed

Publication types