. 2010 Dec 27;191(7):1367-80.
doi: 10.1083/jcb.201007013. Epub 2010 Dec 20.

Proteasome and p97 mediate mitophagy and degradation of mitofusins induced by Parkin

Affiliations

Proteasome and p97 mediate mitophagy and degradation of mitofusins induced by Parkin

Atsushi Tanaka et al. J Cell Biol. .

Abstract

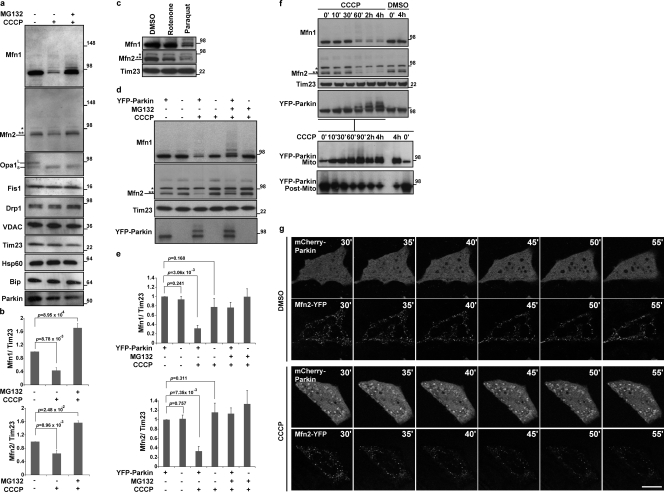
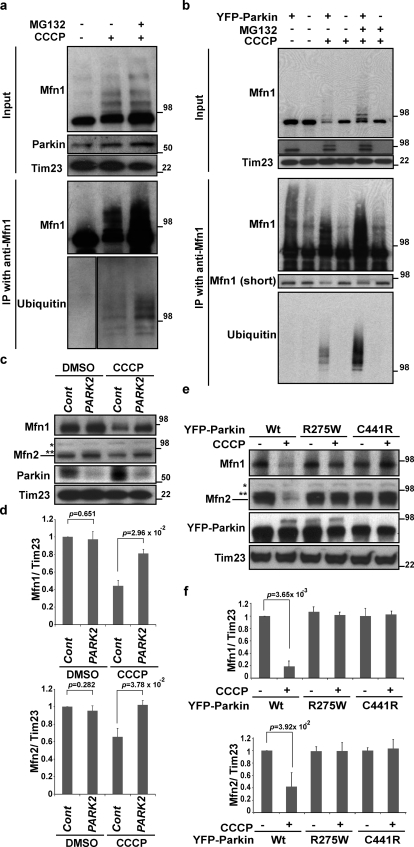
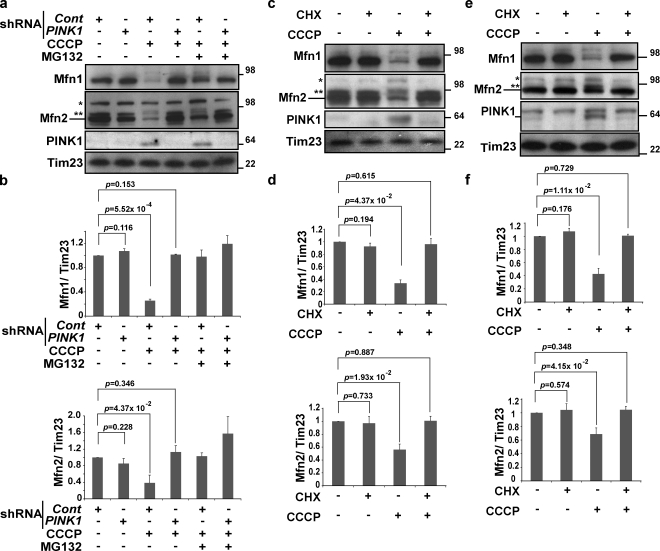
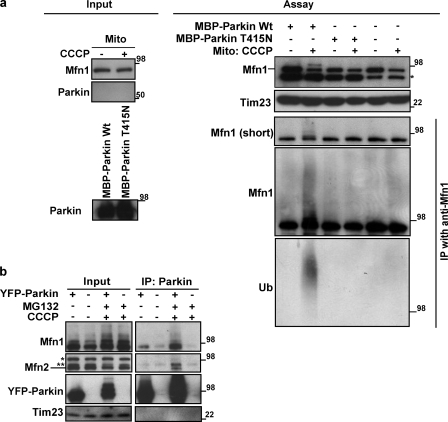
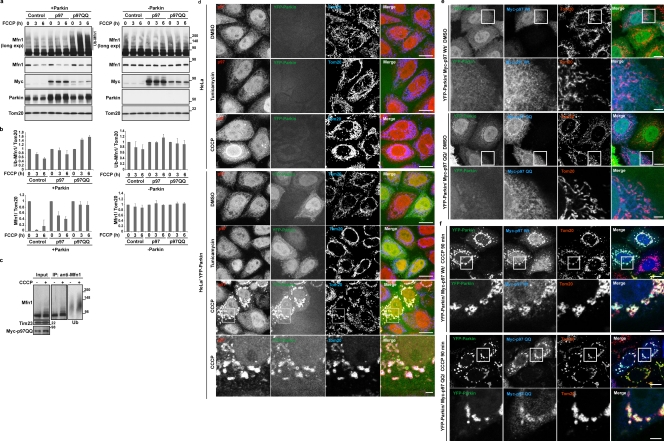
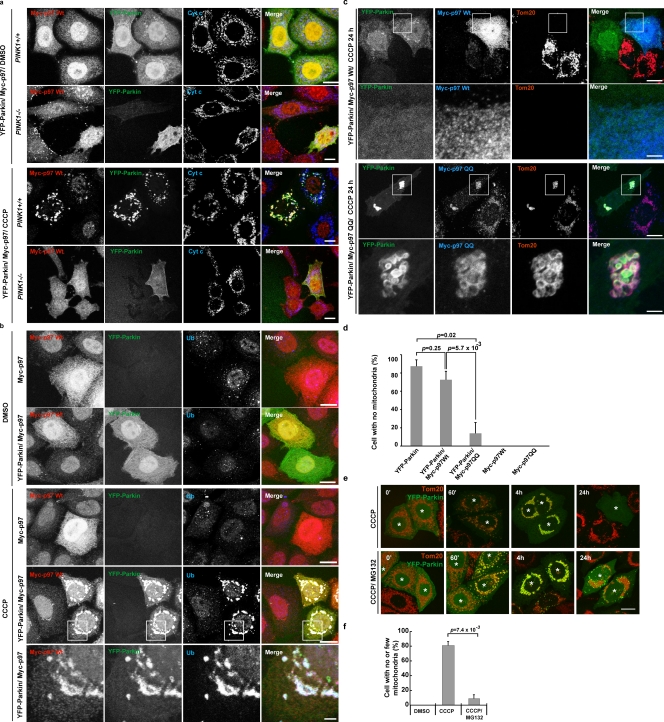
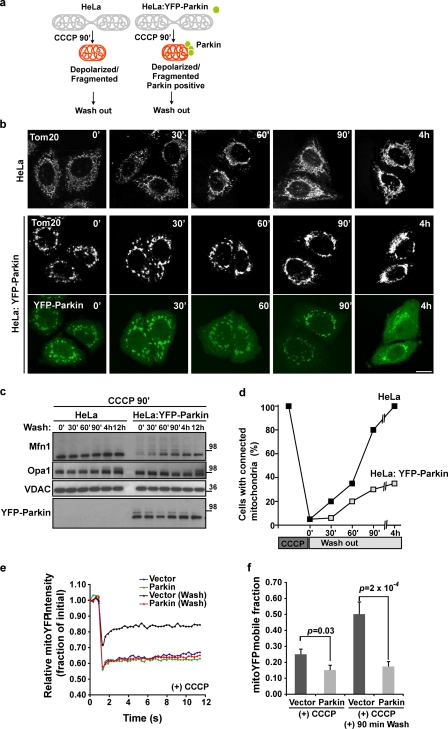
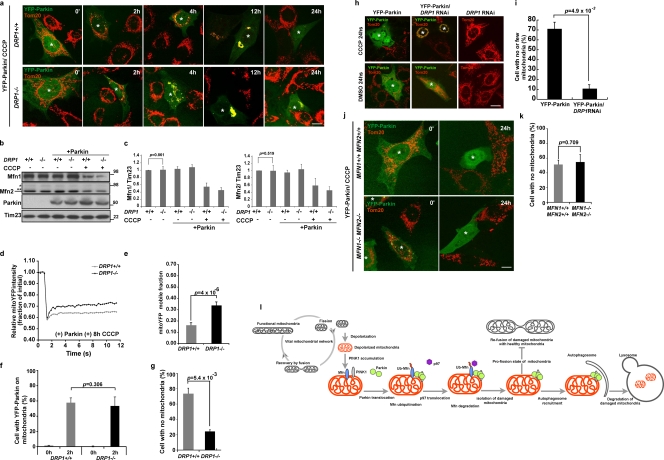
Damage to mitochondria can lead to the depolarization of the inner mitochondrial membrane, thereby sensitizing impaired mitochondria for selective elimination by autophagy. However, fusion of uncoupled mitochondria with polarized mitochondria can compensate for damage, reverse membrane depolarization, and obviate mitophagy. Parkin, an E3 ubiquitin ligase that is mutated in monogenic forms of Parkinson's disease, was recently found to induce selective autophagy of damaged mitochondria. Here we show that ubiquitination of mitofusins Mfn1 and Mfn2, large GTPases that mediate mitochondrial fusion, is induced by Parkin upon membrane depolarization and leads to their degradation in a proteasome- and p97-dependent manner. p97, a AAA+ ATPase, accumulates on mitochondria upon uncoupling of Parkin-expressing cells, and both p97 and proteasome activity are required for Parkin-mediated mitophagy. After mitochondrial fission upon depolarization, Parkin prevents or delays refusion of mitochondria, likely by the elimination of mitofusins. Inhibition of Drp1-mediated mitochondrial fission, the proteasome, or p97 prevents Parkin-induced mitophagy.


Figures

Figure 1.
Figure 1.
Mitochondrial depolarization induces selective degradation of mitofusins by Parkin. (a) Whole cell lysates of SH-SY5Y cells (30 µg of proteins) were subjected to SDS-PAGE after treatment with DMSO (control), CCCP (depolarized), or CCCP with a proteasomal inhibitor, MG132. Immunoblotting results show the stability of mitofusin 1 (Mfn1), mitofusin 2 (Mfn2), Opa1, Fis1, Drp1, VDAC, Tim23, Hsp60, Bip, and Parkin. CCCP, 20 µM for 2 h; MG132, 30 µM, 30 min prior and with CCCP. A single asterisk on the Mfn2 panel indicates a nonspecific band and the double asterisks indicates a cross-reactive band to Mfn1 (Fig. S1, a and b). Opa1 shows conversion from a long form (L) to a shorter form (S) upon depolarization. (b) The average of the Mfn1 or Mfn2 levels normalized to the level of Tim23 is presented with standard deviation indicated by the error bars. Each graph was generated from three independent experiments as described for panel a. The protein levels in control (nontreated) cells were set as 1. (c) Whole cell lysates (30 µg of proteins) of SH-SY5Y cells subjected to SDS-PAGE after treatments with DMSO, Rotenone, or Paraquat are shown. An asterisk on the Mfn2 panel indicates a nonspecific band and the double asterisks indicate a cross-reactive band to Mfn1. Rotenone, 100 nM for 24 h; Paraquat, 2 mM for 24 h. (d) Whole cell lysates (10 µg of proteins) of HeLa cells or HeLa cells stably transfected with YFP-Parkin were subjected to SDS-PAGE after treatment with DMSO, CCCP, or CCCP with MG132. An asterisk on the Mfn2 panel indicates a nonspecific band and the double asterisks indicate a cross-reactive band to Mfn1. CCCP, 10 µM for 90 min; MG132, 30 µM, 30 min prior and with CCCP. (e) The average of Mfn1 or Mfn2 levels normalized to the level of Tim23 is presented with standard deviation indicated by the error bars. Each graph was generated from three independent experiments from d. The protein levels in control (nontreated, HeLa cells stably transfected with YFP-Parkin) cells were set as 1. Molecular mass is indicated in kilodaltons next to the gel blots. (f) Whole cell lysates of HeLa cells stably transfected with YFP-Parkin (top, 10 µg of proteins) were fractionated into mitochondrial and the postmitochondrial fractions (bottom). The asterisk on the Mfn2 panel indicates a nonspecific band, and the double asterisks indicate a cross-reactive band to Mfn1. CCCP, 10 µM. (g) HeLa cells transiently expressing Mfn2-YFP and mCherry-Parkin were treated with DMSO or CCCP. After 30 min of CCCP or DMSO treatment (time 30’), live cell images were captured every 5 min by confocal microscopy. CCCP, 10 µM. Bar, 10 µm.
Figure 2.
Figure 2.
Mitofusin ubiquitination requires Parkin ligase activity. (a and b) SH-SY5Y (a), HeLa cells, or HeLa cells stably transfected with YFP-Parkin (b) were collected as cell lysates with denaturing buffer (see Materials and methods), then subjected to IP with anti-Mfn1 antibody. IP products were detected with anti-Mfn1 and anti-Ub (P4D1). CCCP, 10 µM for 2 h for SH-SY5Y cells, 90 min for HeLa cells; MG132, 30 µM, 30 min prior and with CCCP. (c) Whole cell lysates of SH-SY5Y cells transfected with control siRNA or PARK2 siRNA were treated with DMSO or CCCP. An asterisk on the Mfn2 panel indicates a nonspecific band and the double asterisks indicate a cross-reactive band to Mfn1. CCCP, 20 µM for 2 h. (d) The average of the Mfn1 or Mfn2 level normalized to the level of Tim23 is presented with standard deviation indicated by the error bars. Each graph was generated from three independent experiments from c. The protein levels in control (nontreated, control siRNA) cells were set as 1. (e) HeLa cells transiently transfected with wild-type or two patient mutations of YFP-Parkin were treated with or without CCCP. Whole cell lysates were subjected to immunoblotting with anti-Mfn1, Mfn2, Parkin, and Tim23. CCCP, 10 µM for 90 min. An asterisk on the Mfn2 panel indicates a nonspecific band and the double asterisks indicates a cross-reactive band to Mfn1. Molecular mass is indicated in kilodaltons next to the gel blots. (f) The average of the Mfn1 or Mfn2 levels normalized to the level of Tim23 is presented with standard deviation indicated by the error bars. Each graph was generated from three independent experiments from e. The protein levels in control (nontreated, with each YFP-Parkin expression) cells were set as 1.
Figure 3.
Figure 3.
Mitofusin degradation requires PINK1 expression. (a) M17 cells expressing control or PINK1 shRNA were treated with CCCP or CCCP plus MG132. Lysates were immunoblotted with anti-Mfn1, Mfn2, PINK1, and Tim23. CCCP, 20 µM for 4 h; MG132, 30 µM, 30 min prior and with CCCP. (b) The average of Mfn1 or Mfn2 levels normalized to the level of Tim23 is presented with the standard deviation indicated by the error bars. Each graph was generated from three independent experiments from panel a. The protein levels in control (nontreated, control shRNA) cells were set as 1. (c) HeLa cells stably transfected with YFP-Parkin were pretreated with CHX before treatment with CCCP, as indicated on top. Lysates were immunoblotted with anti-Mfn1, Mfn2, PINK1, and Tim23. CCCP, 10 µM for 90 min; CHX, 100 µM, 30 min prior as a pretreatment and during incubation with or without CCCP. (d) The average of the Mfn1 or Mfn2 level normalized to the level of Tim23 is presented with the standard deviation indicated by the error bars. Each graph was generated from three independent experiments from c. The protein levels in control (nontreated) cells were set as 1. (e) SH-SY5Y cells were pretreated with CHX before the treatments of CCCP, as indicated on top. Lysates were immunoblotted with anti-Mfn1, Mfn2, PINK1, and Tim23. CCCP, 20 µM for 2 h; CHX, 100 µM, 30 min prior as a pretreatment and during incubation with or without CCCP. Molecular mass is indicated in kilodaltons next to the gel blots. (f) The average of the Mfn1 or Mfn2 level normalized to the level of Tim23 is presented with the standard deviation indicated by the error bars. Each graph was generated from three independent experiments from e. The protein levels in control (nontreated) cells were set as 1.
Figure 4.
Figure 4.
Mitofusin ubiquitination requires Parkin and depolarization of mitochondria. (a) Mitochondrial fractions (30 µg) from HeLa cells treated with or without CCCP and recombinant MBP-Parkin wild-type or MBP-Parkin T415N proteins (left) were subjected to the in vitro ubiquitination assay (right). Isolated mitochondria were incubated with MBP-Parkin wild type or T415N. Reaction mixtures were subjected to the denatured IP with anti-Mfn1 antibody as in Fig. 2. IP products were detected with anti-Mfn1 and anti-Ub (P4D1). UbcH7 was used as an E2 enzyme. The asterisk indicates a nonspecific band from MBP proteins or other reaction components. (b) HeLa cells or HeLa cells stably transfected with YFP-Parkin were subjected to nondenaturing IP with anti-Parkin antibody (PRK8). IP products were detected by anti-Parkin, Mfn1, and Mfn2. CCCP, 10 µM for 90 min; MG132, 30 µM, 30 min prior and with CCCP. An asterisk on the Mfn2 panel indicates a nonspecific band and the double asterisks indicate a cross-reactive band to Mfn1. Molecular mass is indicated in kilodaltons next to the gel blots.
Figure 5.
Figure 5.
AAA+ ATPase p97 mediates mitofusin degradation and accumulates on mitochondria after depolarization. (a) HeLa cells or HeLa cells transiently expressing Parkin were transfected with wild-type Myc-p97 or dominant-negative Myc-p97QQ (E305Q/E578Q). After treatment with 10 µM FCCP for the indicated times, cells and mitochondrial fractions were collected as in Fig. 1 f. (b) The average of ubiquitinated (top) or nonubiquitinated (bottom) Mfn1 or Mfn2 normalized to the level of Tom20 is presented with the standard deviation indicated by the error bars. Each graph was generated from three independent experiments from panel a. The protein levels at time 0 were set as 1. (c) HeLa cells stably transfected with YFP-Parkin were transiently transfected with Myc-p97QQ and collected as cell lysates with denaturing buffer, then subjected to IP with anti-Mfn1 antibody. IP products were detected with anti-Mfn1 and anti-Ub (P4D1). CCCP, 10 µM for 90 min. Molecular mass is indicated in kilodaltons next to the gel blots. (d) HeLa cells or HeLa cells transiently transfected with YFP-Parkin were treated with DMSO, Tunicamycin, or CCCP. Cells were immunostained with anti-p97 and anti-Tom20. The boxed regions are magnified in the bottom panels. Tunicamycin, 5 µg/ml for 6 h; CCCP, 10 µM for 90 min. (e and f) HeLa cells transiently transfected with YFP-Parkin and wild-type Myc-p97 or Myc-p97QQ were treated with DMSO (e) or CCCP (f). Cells were fixed and immunostained with anti-Myc and anti-Tom20 antibodies. The boxed regions are magnified in the bottom panels. CCCP, 10 µM for 90 min. Bars: (top panels) 10 µm; (bottom enlarged panels) 1 µm.
Figure 6.
Figure 6.
p97 recruitment to ubiquitinated mitochondria mediates PINK1–Parkin-induced mitochondrial elimination. (a) MEFs from PINK1+/+ or PINK1−/− mice were transiently transfected with YFP-Parkin and Myc-p97. Cells were treated with DMSO or CCCP, then immunostained with anti-Myc and anti–cytochrome c. CCCP, 20 µM for 2 h. Bar, 10 µm. (b) HeLa cells transiently expressing Myc-p97 or YFP-Parkin/Myc-p97 were treated with DMSO or CCCP. Cells were immunostained with anti-Myc and anti-Ub (fk1). CCCP, 10 µM for 90 min. The boxed regions are magnified in the bottom panels. (c) HeLa cells were transiently transfected with YFP-Parkin and wild-type Myc-p97 or Myc-p97QQ. After treatment with CCCP for 24 h, cells were fixed and immunostained with anti-Myc and anti-Tom20 antibodies. CCCP, 10 µM. The boxed regions are magnified in the bottom panels. Bars: (top panels) 10 µm; (bottom enlarged panels) 1 µm. (d) Parkin-induced mitophagy in cells shown as in c was quantified (n > 50). CCCP, 10 µM for 24 h. Data represent the mean ± SD with P values of at least three replicates. (e) HeLa cells or HeLa cells expressing YFP-Parkin were treated with CCCP or CCCP plus MG132. Mitochondria were immunostained with anti-Tom20. Cells expressing YFP-Parkin are indicated with asterisks. CCCP, 10 µM for 24 h; MG132, 30 µM 30 min prior and with CCCP. Bar, 10 µm. (f) MG132 blocks Parkin-induced mitophagy in HeLa cells as in d. A quantification is shown. Data represent the mean ± SD with P values of at least three replicates.
Figure 7.
Figure 7.
Parkin-promoted mitofusin degradation prevents refusion of damaged mitochondria with healthy mitochondria. (a) Scheme of washout design. HeLa cells or HeLa cells stably transfected with YFP-Parkin (green) were treated with CCCP for 90 min. (b and c) After washing CCCP out and further culture, cells were immunostained (b) and immunoblotted (c) with anti-Tom20, VDAC, Mfn1, Opa1, and Parkin. CCCP, 10 µM for 90 min. Bar, 10 µm. Molecular mass is indicated in kilodaltons next to the gel blots. (d) The recovery rate of the mitochondrial network as in b was plotted. At least 100 cells were counted for the cells with connected networks of mitochondria. (e) After CCCP treatment for 90 min with or without washing out CCCP, HeLa cells transiently expressing Mito-YFP with mCherry empty vector (vector) or mCherry-Parkin (Parkin) were subjected to FRAP assays. The curve represents an average of 30 individual FRAP curves. (f) The mobile fractions of Mito-YFP from e.
Figure 8.
Figure 8.
Mitochondrial fission is required for Parkin-mediated mitophagy. (a) MEFs from DRP1+/+ or DRP1−/− mice were transiently transfected with YFP-Parkin. Cells were treated with CCCP and then immunostained with anti-Tom20. Cells expressing YFP-Parkin are indicated with asterisks. CCCP, 20 µM. Bar, 10 µm. (b) Whole cell lysates from DRP1+/+ or DRP1−/− MEFs with or without transient expression of Parkin were subjected to SDS-PAGE. Molecular mass is indicated in kilodaltons next to the gel blots. (c) The average of the Mfn1 or Mfn2 level normalized to the level of Tim23 is presented with the standard deviation indicated by the error bars. Each graph was generated from three independent experiments from b. The protein levels in control (nontreated, nontransfected) cells were set as 1. (d) Clumping mitochondria in DRP1+/+ or DRP1−/− MEFs transiently expressing mCherry-Parkin and Mito-YFP were subjected to the FRAP assay. The curve represents an average of 30 individual FRAP curves. CCCP, 20 µM for 8 h. (e) The mobile fractions of Mito-YFP in d. (f and g) YFP-Parkin translocation (f) and YFP-Parkin–induced mitophagy (g) in DRP1+/+ or DRP1−/− MEFs treated with CCCP as in panel a were quantified (n > 50). CCCP, 20 µM for 24 h. Data represent the mean ± SD with P values of at least three replicates. (h) HeLa cells treated with DRP1 shRNA or control HeLa cells were transiently transfected with YFP-Parkin and treated with or without CCCP. Mitochondria were immunostained with anti-Tom20. Cells expressing YFP-Parkin are indicated with asterisks. CCCP, 10 µM for 24 h. Bar, 10 µm. (i) YFP-Parkin–induced mitophagy in HeLa cells with or without DRP1 RNAi as in h was quantified (n > 50). CCCP, 10 µM for 24 h. Data represent the mean ± SD with P values of at least three replicates. (j and k) YFP-Parkin–induced mitophagy in MFN1+/+2+/+ MEFs or MFN1−/−2−/− MEFs was observed (j) and quantified (k) (n > 50). CCCP, 20 µM for 24 h. Data represent the mean ± SD with P values of at least three replicates. Cells expressing YFP-Parkin are indicated with asterisks. (l) A model for Parkin-mediated Mfn degradation and mitophagy. Depolarized mitochondria (orange) that accumulated PINK1 (gray) are sensed by Parkin (green). After Parkin recruitment to the damaged mitochondria, mitochondrial Parkin induces mitofusin (blue) ubiquitination and degradation. Degradation of mitofusin is regulated by p97 (purple) and is important to prevent impaired mitochondria from fusing with the vital mitochondrial network. Damaged mitochondria isolated by Parkin are engaged with autophagosomes and eliminated by auto-lysosomes.

References

    1. Amiott E.A., Cohen M.M., Saint-Georges Y., Weissman A.M., Shaw J.M. 2009. A mutation associated with CMT2A neuropathy causes defects in Fzo1 GTP hydrolysis, ubiquitylation, and protein turnover. Mol. Biol. Cell. 20:5026–5035 10.1091/mbc.E09-07-0622 - DOI - PMC - PubMed
    1. Betarbet R., Sherer T.B., MacKenzie G., Garcia-Osuna M., Panov A.V., Greenamyre J.T. 2000. Chronic systemic pesticide exposure reproduces features of Parkinson’s disease. Nat. Neurosci. 3:1301–1306 10.1038/81834 - DOI - PubMed
    1. Brooks A.I., Chadwick C.A., Gelbard H.A., Cory-Slechta D.A., Federoff H.J. 1999. Paraquat elicited neurobehavioral syndrome caused by dopaminergic neuron loss. Brain Res. 823:1–10 10.1016/S0006-8993(98)01192-5 - DOI - PubMed
    1. Büeler H. 2009. Impaired mitochondrial dynamics and function in the pathogenesis of Parkinson’s disease. Exp. Neurol. 218:235–246 10.1016/j.expneurol.2009.03.006 - DOI - PubMed
    1. Chen H., Chomyn A., Chan D.C. 2005. Disruption of fusion results in mitochondrial heterogeneity and dysfunction. J. Biol. Chem. 280:26185–26192 10.1074/jbc.M503062200 - DOI - PubMed

Publication types

MeSH terms

Substances