. 2010 Dec 27;191(7):1285-97.
doi: 10.1083/jcb.201007074. Epub 2010 Dec 20.

Chk1 inhibits replication factory activation but allows dormant origin firing in existing factories

Affiliations

Chk1 inhibits replication factory activation but allows dormant origin firing in existing factories

Xin Quan Ge et al. J Cell Biol. .

Abstract

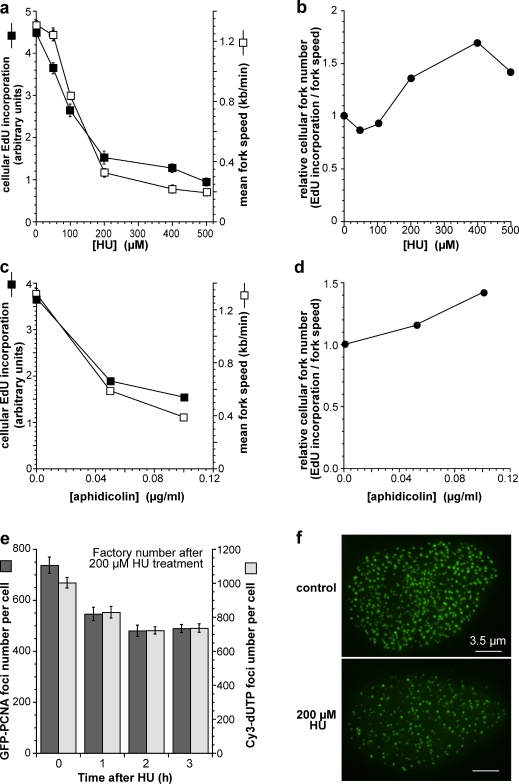
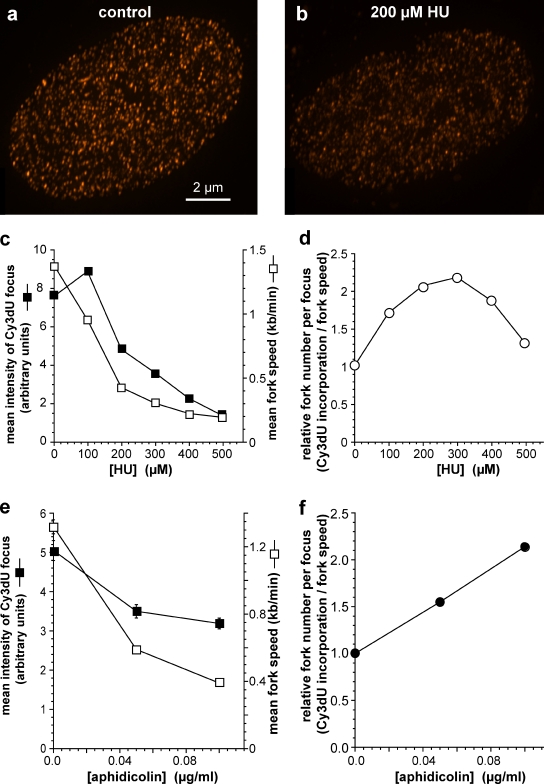
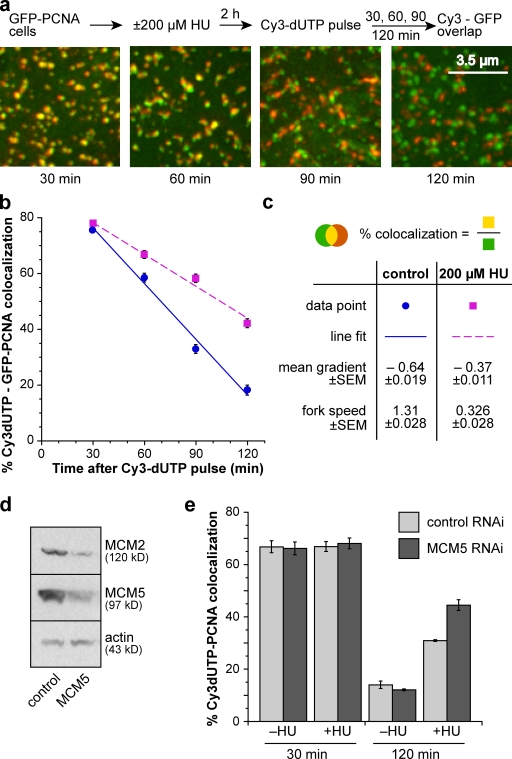
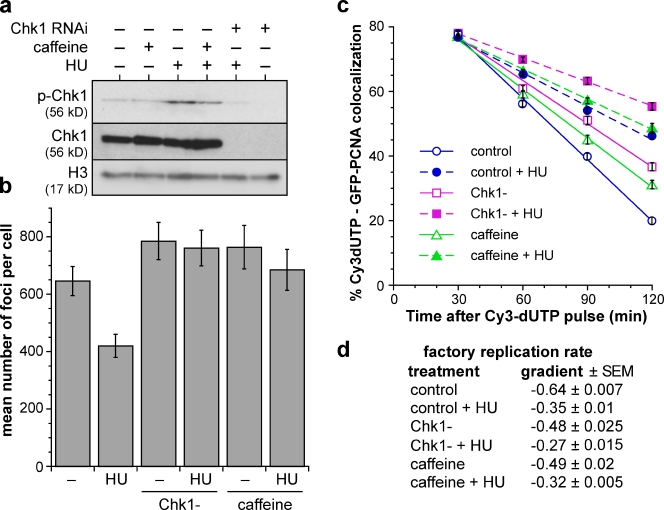
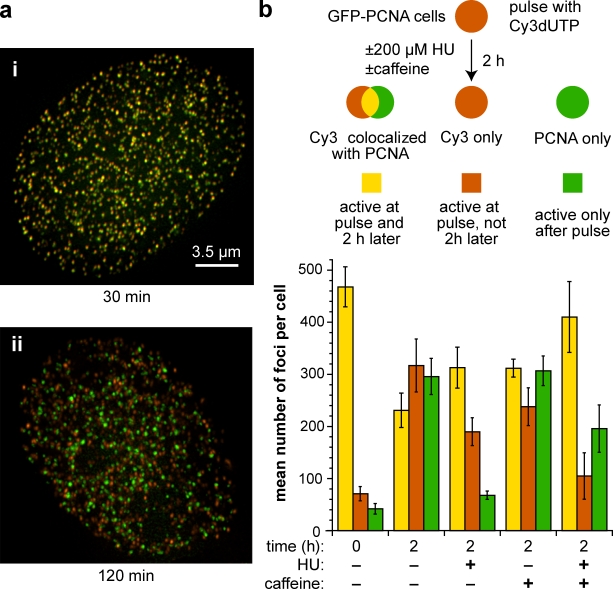
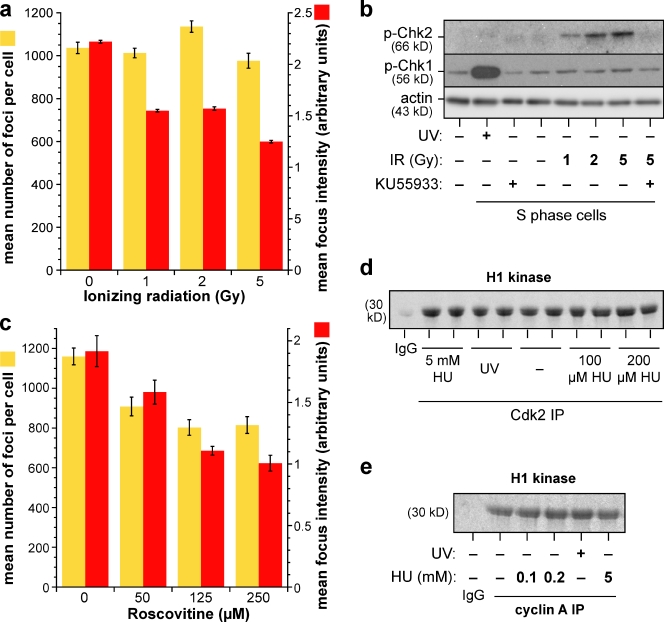
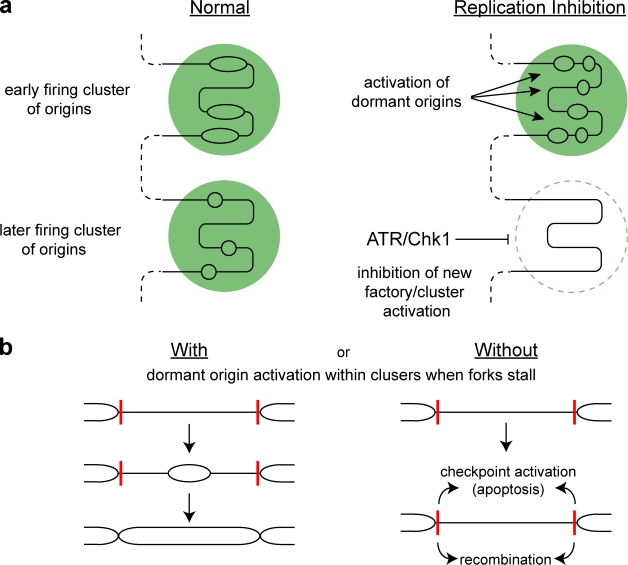
Replication origins are licensed by loading MCM2-7 hexamers before entry into S phase. However, only ∼10% of licensed origins are normally used in S phase, with the others remaining dormant. When fork progression is inhibited, dormant origins initiate nearby to ensure that all of the DNA is eventually replicated. In apparent contrast, replicative stress activates ataxia telangiectasia and rad-3-related (ATR) and Chk1 checkpoint kinases that inhibit origin firing. In this study, we show that at low levels of replication stress, ATR/Chk1 predominantly suppresses origin initiation by inhibiting the activation of new replication factories, thereby reducing the number of active factories. At the same time, inhibition of replication fork progression allows dormant origins to initiate within existing replication factories. The inhibition of new factory activation by ATR/Chk1 therefore redirects replication toward active factories where forks are inhibited and away from regions that have yet to start replication. This minimizes the deleterious consequences of fork stalling and prevents similar problems from arising in unreplicated regions of the genome.


Figures

Figure 1.
Figure 1.
Overall origin initiation and active replication factories is reduced by HU or aphidicolin. (a–d) U2OS cells were treated with 0–500 µM HU or 0–0.1 µg/ml aphidicolin for 4 h before pulsing with 10 µM EdU for 30 min. (a and c, closed squares) Cellular EdU incorporation was detected by flow cytometry with mean and SEM calculated from three independent experiments. (a and c, open squares) DNA fiber analysis was performed on parallel samples to determine mean fork speed. The ratio of cellular EdU incorporation to fork speed (b and d) indicates the relative number of forks per cell. (e and f) U2OS cells were synchronized in early S phase by nocodazole shake off followed by incubation with thymidine for 12 h. Cells were released from thymidine for 1 h and treated with HU for 2 h. (e) The number of active replication factories was determined by either transfecting cells with GFP-PCNA 24 h before synchronization or pulsing cells with Cy3-dUTP and fixing after 30 min. Mean cellular foci number and SEM were derived from >50 cells. (f) Representative images of factories labeled with GFP-PCNA.
Figure 2.
Figure 2.
Dormant origins activated within existing replication factories in response to replicative stress. U2OS cells were synchronized in early S phase and treated with HU for 2 h as in Fig. 1. Cells were pulsed with Cy3-dUTP for 30 min before fixing. (a and b) Representative images of control (a) and 200 µM HU-treated cells (b). (c–f) The intensity of individual Cy3-dUTP foci was measured and averaged in each cell. (c and e, closed squares) Analysis of 50 cells under each condition gave rise to the overall mean foci intensity with SEM (error bars). (c and e, open squares) The replication fork speed of the samples was measured by DNA fiber analysis. The ratio of mean Cy3-dUTP focus intensity to fork speed (d and f) indicates the relative number of forks within each replication focus.
Figure 3.
Figure 3.
HU activates dormant origins within active replication factories. U2OS cells were synchronized in early S phase as described in Fig. 1. (a–c) Cells were transfected with GFP-PCNA 24 h before synchronization in early S phase. After HU treatment, cells were transfected with Cy3-dUTP and fixed for 30, 60, 90, or 120 min to analyze the percentage of colocalization between Cy3-dUTP (red) and GFP-PCNA foci (green). (a) Labeling scheme and representative images are shown. The percentage of colocalization within individual cells was calculated by dividing the colocalized volume of Cy3 and GFP-PCNA foci by the total volume of GFP-PCNA foci. Analysis of >40 cells gave rise to the mean percentage of colocalization at each time point and SEM. (b) Lines were fitted to the data points to calculate the gradient, which indicates the rate of replication within the factories. (c) Composite data from three independent experiments were combined to give a mean gradient and SEM between the three experiments. (d and e) U2OS cells were transfected with MCM5 siRNA 72 h before synchronization in early S phase. (d) Chromatin-bound MCM2 and MCM5 levels were determined by immunoblotting after MCM5 siRNA. After 200 µM HU treatment, cells were transfected with Cy3-dUTP and fixed for 30 or 120 min afterward. (e) The percentage of colocalization between Cy3-dUTP and PCNA foci (as revealed by anti-PCNA immunofluorescence) is shown.
Figure 4.
Figure 4.
The effect of checkpoint inhibition on replication factories. Cells were transfected with GFP-PCNA 24 h before synchronization in early S phase, and the DNA damage checkpoint in these cells was inhibited by either CHK1 siRNA (transfected simultaneously with GFP-PCNA) or 5 mM caffeine. (a) Total cell lysate was immunoblotted for phospho-Chk1, Chk1, and H3. (b) U2OS cells were synchronized in early S phase as described for Fig. 1. After release from thymidine for 1 h, cells were treated with 200 µM HU for 2 h in the presence or absence of caffeine. The number of GFP-PCNA foci in each cell (>50 cells analyzed for each condition) was determined, with error bars representing SEM. (c and d) The rate of DNA replication within factories was measured by the protocol described in Fig. 3, but this time, comparing cells where the checkpoint was inhibited by Chk1 siRNA or caffeine. (c) Data from one set of experiments are shown. Analysis of >50 cells gave rise to the mean percentage of colocalization at each time point and SEM. Lines were fitted to the data points to calculate the gradient, which indicates the rate of replication within the factories. (d) Two independent experiments (n = 2) were performed to give rise to the mean gradient under each condition, and statistical significance is shown as SEM between the two gradients.
Figure 5.
Figure 5.
Checkpoint kinases inhibit new replication factory activation. Cells were transfected with GFP-PCNA 24 h before synchronization into early S phase as described for Fig. 1. After release from thymidine for 1 h, cells were pulse labeled with Cy3-dUTP followed by treatment with 200 µM HU for 2 h in the presence or absence of caffeine. (a) Representative images of nuclei fixed at 30 (i) or 120 min (ii) after Cy3-dUTP pulse. This shows that cells were in the same early timing stage throughout the experiment. (b) The number of Cy3 foci colocalized with GFP-PCNA foci (>10% volume overlap), Cy3 foci not colocalized with GFP-PCNA foci (<10% volume overlap; Cy3-only foci), and the GFP-PCNA foci not colocalized with cy3 foci (<10% volume overlap; PCNA-only foci) were quantified, and their mean value per cell was represented as yellow, red, and green bars, respectively. Analysis of >50 cells gave rise to mean and SEM (error bars).
Figure 6.
Figure 6.
Effect of different treatments on factory number. (a) After synchronization in early S phase as described in Fig. 1, U2OS cells were irradiated with 1–5 Gy γ ray. 2 h after irradiation, cells were pulsed with Cy3-dUTP. Both the number and intensity of the Cy3-dUTP foci were measured in each cell. The mean and SEM were derived from >50 cells. (b) 2 h after irradiation with 1–5 Gy γ ray or 20 J/m2 UV in the presence or absence of 10 µM ATM inhibitor KU55933, total cell lysate was immunoblotted for phospho-CHK1, phospho-CHK2, and actin. (c) After synchronization in early S phase, U2OS cells were treated with 0–250 µM roscovitine for 2 h and pulse labeled with Cy3-dUTP. Both the number and intensity of Cy3-dUTP foci were measured in each cell. The mean and SEM were derived from >50 cells. (d and e) Cells were synchronized in early S phase and treated with HU or 20 J/m2 UV. 2 h after treatment, cells were lysed for immunoprecipitation with Cdk2 or cyclin A antibody. The associated kinase activity of the immunoprecipitates was assayed on histone H1.
Figure 7.
Figure 7.
Model to show how cells respond to low levels of replicative stress. (a) Two adjacent clusters of origins (factories bounded by green circles) are shown on a single piece of DNA (black lines). Under normal circumstances (left), the upper factory is activated slightly earlier than the factory below, and each initiates three origins. Under low levels of replicative stress (right), replication forks are inhibited in the earlier replicating cluster, which promotes the firing of dormant origins as a direct consequence of stochastic origin firing. Replicative stress activates DNA damage checkpoint kinases, which preferentially inhibit the activation of the unfired later clusters/new factories. (b) A model showing two converging forks on a single piece of DNA (black lines) that have stalled (red bars). If a dormant origin is activated between them, replication can be rapidly rescued (left). If there is no dormant origin firing between the stalled forks (right), the DNA damage response can lead to recombination or induction of apoptosis.

Similar articles

Cited by

References

    1. Anglana M., Apiou F., Bensimon A., Debatisse M. 2003. Dynamics of DNA replication in mammalian somatic cells: nucleotide pool modulates origin choice and interorigin spacing. Cell. 114:385–394 10.1016/S0092-8674(03)00569-5 - DOI - PubMed
    1. Arias E.E., Walter J.C. 2007. Strength in numbers: preventing rereplication via multiple mechanisms in eukaryotic cells. Genes Dev. 21:497–518 10.1101/gad.1508907 - DOI - PubMed
    1. Bartek J., Lukas C., Lukas J. 2004. Checking on DNA damage in S phase. Nat. Rev. Mol. Cell Biol. 5:792–804 10.1038/nrm1493 - DOI - PubMed
    1. Berezney R., Dubey D.D., Huberman J.A. 2000. Heterogeneity of eukaryotic replicons, replicon clusters, and replication foci. Chromosoma. 108:471–484 10.1007/s004120050399 - DOI - PubMed
    1. Blow J.J., Dutta A. 2005. Preventing re-replication of chromosomal DNA. Nat. Rev. Mol. Cell Biol. 6:476–486 10.1038/nrm1663 - DOI - PMC - PubMed

Publication types

MeSH terms

Substances