. 2011 Mar 4;286(9):7348-58.
doi: 10.1074/jbc.M110.171819. Epub 2010 Dec 20.

Sphingosine-1-phosphate lyase deficiency produces a pro-inflammatory response while impairing neutrophil trafficking

Affiliations

Sphingosine-1-phosphate lyase deficiency produces a pro-inflammatory response while impairing neutrophil trafficking

Maria L Allende et al. J Biol Chem. .

Abstract

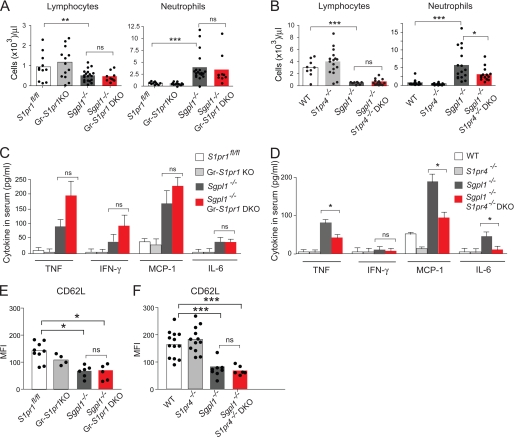
Sphingosine-1-phosphate (S1P) lyase catalyzes the degradation of S1P, a potent signaling lysosphingolipid. Mice with an inactive S1P lyase gene are impaired in the capacity to degrade S1P, resulting in highly elevated S1P levels. These S1P lyase-deficient mice have low numbers of lymphocytes and high numbers of neutrophils in their blood. We found that the S1P lyase-deficient mice exhibited features of an inflammatory response including elevated levels of pro-inflammatory cytokines and an increased expression of genes in liver associated with an acute-phase response. However, the recruitment of their neutrophils into inflamed tissues was impaired and their neutrophils were defective in migration to chemotactic stimulus. The IL-23/IL-17/granulocyte-colony stimulating factor (G-CSF) cytokine-controlled loop regulating neutrophil homeostasis, which is dependent on neutrophil trafficking to tissues, was disturbed in S1P lyase-deficient mice. Deletion of the S1P4 receptor partially decreased the neutrophilia and inflammation in S1P lyase-deficient mice, implicating S1P receptor signaling in the phenotype. Thus, a genetic block in S1P degradation elicits a pro-inflammatory response but impairs neutrophil migration from blood into tissues.


Figures

FIGURE 1.
FIGURE 1.
Numbers of neutrophils and monocytes are increased in Sgpl1−/− mice. A, numbers of neutrophils and monocytes in the blood of Sgpl1+/+ and Sgpl1−/− mice. Cells were stained with anti-Gr-1 and anti-CD11b antibodies and analyzed by flow cytometry. Neutrophils were identified as Gr-1high CD11b+ and monocytes as Gr-1low/- CD11b+. Results are shown as the number of cells per μl of blood. The bars represent mean values, and the closed circles are individual mice. B, increased granulopoiesis in Sgpl1−/− mice. Sgpl1+/+ and Sgpl1−/− mice were pulsed with BrdU, and neutrophils from peripheral blood were analyzed by flow cytometry using anti-Gr-1 and anti-CD11b antibodies in combination with BrdU detection. Results are shown as absolute numbers of BrdU+ Gr-1+ CD11b+ neutrophils per 100 μl of blood. The bars represent mean values and the closed circles are individual mice. C and D, flow cytometry analysis of neutrophils and monocytes in spleen from Sgpl1+/+ and Sgpl1−/− mice. Neutrophils and monocytes were identified as in A. Results are shown as the percentage of cells analyzed (C) and absolute numbers normalized by body weight (D). The bars represent mean values, and the closed circles are individual mice. E and F, flow cytometry analysis of myeloid progenitor cells in bone marrow from Sgpl1+/+ and Sgpl1−/− mice. Myeloid progenitor cells were identified as Gr-1low CD11b+ (immature) and Gr-1high CD11b+(mature). Results are shown as the percentage of cells analyzed (E) and absolute numbers normalized by body weight (F). The bars represent mean values, and the closed circles are individual mice. Sgpl1+/+ mice (open bars), Sgpl1−/− mice (gray bars). All mice were analyzed at P18. *, p < 0.05; **, p < 0.01; ***, p < 0.005. ns, not significant.
FIGURE 2.
FIGURE 2.
Pro-inflammatory markers are elevated during development in Sgpl1−/− mice. A, affymetrix microarray gene expression analysis was performed with liver mRNA from p18 Sgpl1+/+ and Sgpl1−/− mice (n = 3 per genotype). The raw signal values of the genes from the GO category “acute inflammatory response” were clustered to produce a heat map. Red color corresponds to higher expression relative to blue. Probe sets corresponding to acute phase reactants, Orm1–3, Saa1–4, and Lbp, are indicated. B, expression of mRNA for genes related to the inflammatory response in the liver of Sgpl1+/+ and Sgpl1−/− mice at P6 and at P18. RT-qPCR was performed on liver mRNA from Sgpl1+/+ and Sgpl1−/− mice. Data are shown as mean values ± S.D. n = 6 mice per genotype for P6 and n = 7 for P18. C, concentrations of pro-inflammatory cytokines in the serum of Sgpl1+/+ (open bars) and Sgpl1−/− (gray bars) mice. Concentration of serum pro-inflammatory cytokines determined using the BD CBA Array. Data are shown as mean values ± S.D. n = 8 for Sgpl1+/+, n = 12 for Sgpl1−/− mice. Sgpl1+/+ mice (open bars), Sgpl1−/− mice (gray bars). *, p < 0.05; **, p < 0.01; ***, p < 0.005.
FIGURE 3.
FIGURE 3.
Tlr4 deletion does not affect neutrophil levels in blood or pro-inflammatory markers in Sgpl1−/− mice. Lymphocyte and neutrophil blood numbers, pro-inflammatory cytokines in serum, and inflammatory-related markers in liver in WT (open bars), Sgpl1−/− (light gray bars), Tlr4−/− (dark gray bars), and Sgpl1−/− Tlr4−/− DKO (red bars) mice. A, blood lymphocyte and neutrophil counts were determined by the Department of Laboratory Medicine at the NIH using an automated blood cell analyzer. Results are shown as number of cells per μl of blood. The bars represent mean values, and the closed circles are individual mice. B, concentration of pro-inflammatory cytokines in serum determined using the BD CBA Array. Data are shown as mean values ± S.D., n = 9–17 mice per genotype. C, Tnf and Vcam-1 mRNA expression in liver determined using RT-qPCR. Data are shown as mean values ± S.D., n = 4 mice per genotype, all mice were analyzed at P18. *, p < 0.05; ***, p < 0.005. ns, not significant.
FIGURE 4.
FIGURE 4.
Neutrophils are confined to the sinusoids in the liver of Sgpl1−/− mice. Paraffin sections from liver from Sgpl1+/+ (A, C) and Sgpl1−/− (B, D) mice were stained with H&E and examined on a Leica DMLB microscope. All mice were analyzed at P18. A and B, ×10 magnification. C and D, ×100 magnification. Arrows point to leukocytes in the hepatic sinusoids.
FIGURE 5.
FIGURE 5.
Neutrophil migration is impaired in Sgpl1−/− mice. A and B, Sgpl1+/+ and Sgpl1−/− mice were injected intraperitoneal with thioglycollate. After 4 h, blood neutrophils and peritoneal neutrophils in the lavage were analyzed by flow cytometry. A, neutrophil blood counts after thioglycollate treatment. B, efficiency of neutrophil recruitment into the peritoneal cavity (PC) was determined by dividing the concentration of neutrophils obtained in the peritoneal lavage by the concentration of neutrophils in blood after thioglycollate treatment. Results are shown as neutrophil counts per μl of blood (A) and ratio of neutrophil counts in the PC/neutrophil counts in blood. C, deletion of Sgpl1 alters the migration capacity of neutrophils toward fMLP. Total splenocytes from Sgpl1+/+ and Sgpl1−/− mice were added to a Transwell insert and allowed to respond to 1 μm fMLP in the lower well. Percentages of the input that were found in the lower well after a 3-h incubation were plotted for neutrophils. Bars represent averages, and circles individual mice. n = 6 in three independent experiments. The bars represent mean values, and the closed circles are individual mice. Sgpl1+/+ mice (open bars), Sgpl1−/− mice (gray bars). All mice were analyzed at P18. **, p < 0.01; ***, p < 0.005.
FIGURE 6.
FIGURE 6.
Expression of adhesion molecules is decreased on neutrophils from Sgpl1−/− mice. Blood neutrophils were analyzed by flow cytometry for the expression of CD62L (A, F), CD11b (B, G), CD11a (C, H), CD18 (D, I), and CD49d (E, J). Results are shown as histograms (A–E), mean fluorescence intensity (MFI) (F–I), and the ratio of CD49dhigh/CD49dlow Gr-1+ cells (J) from Sgpl1+/+ and Sgpl1−/− mice. In A, B, and E, isotype control staining is shown as a dotted line. In F–J, the bars represent mean values, and the closed circles are individual mice. Sgpl1+/+ mice (black lines and open bars), Sgpl1−/− mice (red lines and red bars). All mice were analyzed at P18. *, p < 0.05; ***, p < 0.005.
FIGURE 7.
FIGURE 7.
Neutrophilia and inflammation are transferred by Sgpl1−/− bone marrow-derived hematopoietic cells. Total bone marrow cells from p18 Sgpl1+/+ and Sgpl1−/− mice were injected i.v. into lethally irradiated adult Rag2−/− mice to generate control Sgpl1+/+Rag2−/− and Sgpl1−/−Rag2−/−. Transplanted mice were analyzed 8 weeks after the procedure. A, blood cell counts determined by flow cytometry. Results are shown as number of cells per μl of blood. The bars represent mean values, and the closed circles are individual mice. B, concentration of pro-inflammatory cytokines in serum determined using the BD CBA Array. Data are shown as mean values ± S.D., n = 9 mice per genotype. C, Tnf and Vcam-1 mRNA expression in liver determined using RT-qPCR. Data are shown as mean values ± S.D. for Sgpl1+/+Rag2−/− mice (n = 5) and for Sgpl1−/−Rag2−/− mice (n = 6). D, CD62L expression on the surface of blood neutrophils was analyzed by flow cytometry. Results are shown as a histogram. The inset shows the mean fluorescence intensity (MFI) for Sgpl1−/−Rag2−/− (n = 5) neutrophils as percentage of control Sgpl1+/+Rag2−/− (n = 4) neutrophil values. Data are shown as mean values ± S.D. E, sphingolipid concentration in serum analyzed by HPLC-MS/MS. Data are shown as mean values ± S.D., n = 12 mice per genotype. Sgpl1+/+Rag2−/− (open bars and black line) and Sgpl1−/−Rag2−/− (red bars and red line). *, p < 0.05. ns, not significant.
FIGURE 8.
FIGURE 8.
S1pr4 deletion lowers blood neutrophil levels and inflammatory markers in Sgpl1−/− mice. S1Pr1fl/fl, Gr-S1pr1KO, Sgpl1−/−, and Sgpl1−/− Gr-S1pr1KO DKO mice (A, C, E), and WT, S1pr4−/−, Sgpl1−/−, and Sgpl1−/− S1pr4−/− DKO mice (B, D, F) were analyzed for blood cell counts, pro-inflammatory cytokines, and CD62L expression on neutrophils. A and B, blood lymphocyte and neutrophil counts were determined by the Department of Laboratory Medicine at the NIH using an automated blood cell analyzer. Results are shown as number of cells per μl of blood. The bars represent mean values, and the closed circles are individual mice. Results are shown as number of cells per μl of blood. The bars represent mean values, and the closed circles are individual mice. C and D, concentration of pro-inflammatory cytokines in serum determined using the BD CBA Array. Data are shown as mean values ± S.D., n = 5. E and F, CD62L expression on the surface of blood neutrophils from DKO mice. E, expression levels of CD62L on S1Pr1fl/fl, Gr-S1pr1KO, Sgpl1−/−, and Sgpl1−/− Gr-S1pr1 DKO neutrophils are shown as mean fluorescence intensity (MFI). F, expression levels of CD62L on WT, S1pr4−/−, Sgpl1−/−, and Sgpl1−/− S1pr4−/− DKO neutrophils are shown as the MFI. The bars represent mean values, and the closed circles are individual mice. All mice were analyzed at P18. *, p < 0.05; **, p < 0.01; ***, p < 0.005. ns, not significant.
FIGURE 9.
FIGURE 9.
Cytokine-controlled loop regulating neutrophil homeostasis is affected in Sgpl1−/− mice. A, Il23a mRNA expression was determined in various tissues by RT-qPCR in Sgpl1+/+ and Sgpl1−/− mice. Data are shown as mean values ± S.D. n = 4–7 mice for each genotype. B, CD4+ T cells from mesenteric lymph nodes from Sgpl1+/+ and Sgpl1−/− mice were stained for IL-17 expression and analyzed by flow cytometry. Data are shown as mean values ± S.D., n = 6. C, IL-17 was measured in the serum of Sgpl1+/+ and Sgpl1−/− mice by ELISA. Data are shown as mean values ± S.D., n = 5. D, concentration of G-CSF in the serum of Sgpl1+/+ and Sgpl1−/− mice determined using the mouse cytokine/chemokine LINCOplex kit. All mice were analyzed at P18. Data are shown as mean values ± S.D., n = 7. E, impact of the Sgpl1 deletion on neutrophil homeostasis (green and red arrows) based on the model proposed by Klaus Ley and co-workers (47, 48). Sgpl1 deletion impedes the migration of blood neutrophils into tissues. Tissue macrophages and dendritic cells respond to reduced phagocytosis of apoptotic neutrophils by increased Il-23 production leading to elevated 1L-17 and G-CSF synthesis. Sgpl1+/+ (open bars) and Sgpl1−/− (gray bars). *, p < 0.05.

Similar articles

Cited by

References

    1. Rosen H., Goetzl E. J. (2005) Nat. Rev. Immunol. 5, 560–570 - PubMed
    1. El Alwani M., Wu B. X., Obeid L. M., Hannun Y. A. (2006) Pharmacol. Ther. 112, 171–183 - PubMed
    1. Kono M., Allende M. L., Proia R. L. (2008) Biochim. Biophys. Acta 1781, 435–441 - PMC - PubMed
    1. Rivera J., Proia R. L., Olivera A. (2008) Nat. Rev. Immunol. 8, 753–763 - PMC - PubMed
    1. Kim R. H., Takabe K., Milstien S., Spiegel S. (2009) Biochim. Biophys. Acta 1791, 692–696 - PMC - PubMed

Publication types

MeSH terms