. 2011 Jan 4;108(1):179-84.
doi: 10.1073/pnas.1013004108. Epub 2010 Dec 20.

Mouse telomerase reverse transcriptase (mTert) expression marks slowly cycling intestinal stem cells

Affiliations

Mouse telomerase reverse transcriptase (mTert) expression marks slowly cycling intestinal stem cells

Robert K Montgomery et al. Proc Natl Acad Sci U S A. .

Abstract

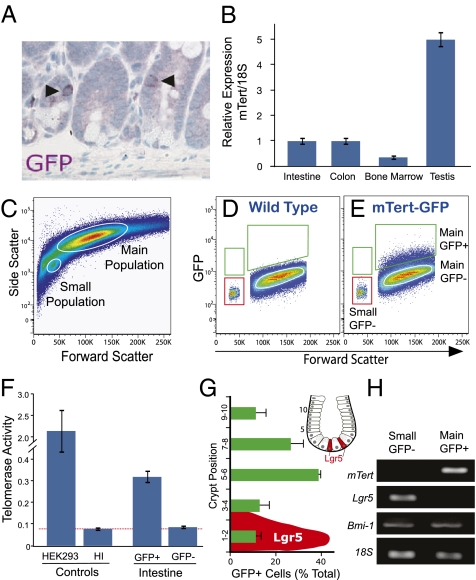
The intestinal epithelium is maintained by a population of rapidly cycling (Lgr5(+)) intestinal stem cells (ISCs). It has been postulated, however, that slowly cycling ISCs must also be present in the intestine to protect the genome from accumulating deleterious mutations and to allow for a response to tissue injury. Here, we identify a subpopulation of slowly cycling ISCs marked by mouse telomerase reverse transcriptase (mTert) expression that can give rise to Lgr5(+) cells. mTert-expressing cells distribute in a pattern along the crypt-villus axis similar to long-term label-retaining cells (LRCs) and are resistant to tissue injury. Lineage-tracing studies demonstrate that mTert(+) cells give rise to all differentiated intestinal cell types, persist long term, and contribute to the regenerative response following injury. Consistent with other highly regenerative tissues, our results demonstrate that a slowly cycling stem cell population exists within the intestine.


Conflict of interest statement

The authors declare no conflict of interest.

Figures

Fig. 1.
Fig. 1.
Analysis of mTert-expressing cells in the intestine. (A) Immunohistochemical analysis of GFP in the intestine. Arrowheads indicate single GFP+ crypt cells. Magnification, 40×. (B) Quantitative RT-PCR analysis of mTert expression in adult mouse small intestine, colon, bone marrow, and testis. To normalize the level of input RNA, 18S was used. A representative analysis is shown. Bars represent mean ± SEM, performed in duplicate. (CE) FACS analysis of single intestinal cells harvested from mTert–GFP mice. (C) A representative forward and side-scatter plot depicts events already gated for live intestinal cells. The small and main cell populations are circled. (D and E) Representative wild type (D) and mTert–GFP (E) forward-scatter and GFP plots are shown. Events depicted have already been gated for live, CD45 small and main cell populations. GFP+ cells, green gate; GFP cells from the small cell population, red gate; GFP cells from the main cell population, white circle. (F) Telomerase activity for GFP+ or GFP FACS-isolated intestinal cells from the main and small cell populations, respectively. HEK293 cell extracts, positive control; heat inactivated (HI) HEK293 cell extracts, negative control. Data shown are from two to four experiments, each performed in duplicate. (G) Distribution of GFP+ cells within the intestinal crypt relative to the crypt bottom. Bars represent mean ± SEM of two separate experiments with a total of 96 cells counted. Distribution of Lgr5+ cells (in red) as previously published (4). Inset shows a schematic illustration of a crypt with Lgr5+ cells in red and crypt cell numbering. (H) RT-PCR analysis for mTert, Lgr5, Bmi-1, and 18S on FACS-purified GFP and GFP+ cells corresponding to the gates in E.
Fig. 2.
Fig. 2.
Telomerase-positive cells are slowly cycling and do not express activated stem cell markers. (A) Confocal analysis of GFP and Ki67 expression in intestinal crypts. Arrowhead indicates a GFP+Ki67 cell. Magnification, 63×. Gamma correction was applied to reduce background fluorescence. (B) Representative Ki67 and side-scatter plots depict events already gated for live, CD45, main GFP+ (Upper) or small GFP (Lower) cell populations. (C) Percentage of Ki67+ cells within the GFP+ and GFP cell populations. Bars represent mean ± SEM of two independent experiments performed with five replicates. (DF) Coimmunofluorescence for GFP and P-β-catS552 in intestinal crypts. DAPI (blue) counterstain. Magnification, 60×.
Fig. 3.
Fig. 3.
Lineage-tracing in the small intestine and colon. Histological or whole mount analysis of intestinal LacZ staining following pulse (AF) or greater than 1-mo chase (GL). (MR) Histological analysis of LacZ staining in the various intestinal epithelial cell lineages after 1-mo chase. Colabeling of LacZ and periodic acid-Schiff (PAS) positive cells corresponding to goblet (M and N) and Paneth (O and P) cells. (Q and R) Colocalization of the enteroendocrine marker, chromogranin-A (Q) and LacZ staining (R). Arrow indicates an enteroendocrine cell. (SU) Analysis of long-term labeling of colonic crypts by whole mount analysis following 1-mo (U) or 6-mo (S and T) chase. Arrows demarcate LacZ+ colonic crypts at low power (S) and crypt openings at higher power (T and U). A crypt duplication event is shown by arrowhead and hatched box in S and at higher magnification (T, white arrow). (V and W) Colabeling of LacZ+ and PAS+ colonic goblet cells after 6-mo chase. Representative pictures are shown for all results. Magnification for histological images is 60× and 2–10× for whole mount images.
Fig. 4.
Fig. 4.
Frequency of LacZ-marked crypts under basal and regenerative conditions. Analysis of intestinal LacZ-marked crypts using the whole mount LacZ crypt assay. (A) Analysis of crypts marked with single, few (two to four) or multiple (five or more) LacZ+ cells under basal conditions. Crypts marked with five or more cells correspond to fully marked crypt/villus units (stripe). Inset is a representative image (arrow) and schematic illustration of a crypt containing a single LacZ+ cell. The percentage for each group is shown. (B) Analysis of total LacZ-marked crypts following varying doses of radiation. (C) Fold increase in the fraction of crypts from B marked by single cells or multiple cells. Bars represent mean ± SEM obtained from two to three animals per group, ANOVA P < 0.001, (*) Bonferroni posttest.
Fig. 5.
Fig. 5.
mTert+ cells contribute to Lgr5+ cells. (A) Schematic illustration of flow cytometry plots showing the small cell (Lgr5+) and main cell (mTert+) populations at pulse and chase. Open circles, unstained cells; blue circles, LacZ+ cells. LacZ+ cells in the main population give rise to both small and main cell populations (model 1) or only to the main cell population (model 2). (BG) Flow cytometric analysis of LacZ+ cells at pulse (BD) or chase (EG). Representative fluorescein and forward-scatter plots depict events already gated for live, CD45 intestinal cells and indicate LacZ+ cells within the small (dashed gate) and main (red gate) cell populations. Control cells from wild-type or placebo-treated bigenic mice used to set the fluorescent gates. (D and G) Quantitation of the percentage of LacZ+ cells from the small or main cell populations following pulse (D) or chase (G). A representative experiment is shown; bars represent mean ± SEM. Nine mice were assayed in duplicate or triplicate. (H and I) RT-PCR analysis of Lgr5 and 18S expression in FACS-isolated small and main cell populations following pulse (H) or chase (I). Positive (+) control corresponds to whole intestine cDNA.

References

    1. Potten CS, Loeffler M. Stem cells: Attributes, cycles, spirals, pitfalls and uncertainties. Lessons for and from the crypt. Development. 1990;110:1001–1020. - PubMed
    1. Scoville DH, Sato T, He XC, Li L. Current view: Intestinal stem cells and signaling. Gastroenterology. 2008;134:849–864. - PubMed
    1. Montgomery RK, Breault DT. Small intestinal stem cell markers. J Anat. 2008;213:52–58. - PMC - PubMed
    1. Barker N, et al. Identification of stem cells in small intestine and colon by marker gene Lgr5. Nature. 2007;449:1003–1007. - PubMed
    1. van der Flier LG, et al. Transcription factor achaete scute-like 2 controls intestinal stem cell fate. Cell. 2009;136:903–912. - PubMed

Publication types

MeSH terms