

A network model for plant-pollinator community assembly
- PMID: 21173234
- PMCID: PMC3017189
- DOI: 10.1073/pnas.1008204108
A network model for plant-pollinator community assembly
Abstract
Community assembly models, usually constructed for food webs, are an important component of our understanding of how ecological communities are formed. However, models for mutualistic community assembly are still needed, especially because these communities are experiencing significant anthropogenic disturbances that affect their biodiversity. Here, we present a unique network model that simulates the colonization and extinction process of mutualistic community assembly. We generate regional source pools of species interaction networks on the basis of statistical properties reported in the literature. We develop a dynamic synchronous Boolean framework to simulate, with few free parameters, the dynamics of new mutualistic community formation from the regional source pool. This approach allows us to deterministically map out every possible trajectory of community formation. This level of detail is rarely observed in other analytic approaches and allows for thorough analysis of the dynamical properties of community formation. As for food web assembly, we find that the number of stable communities is quite low, and the composition of the source pool influences the abundance and nature of community outcomes. However, in contrast to food web assembly, stable mutualistic communities form rapidly. Small communities with minor fluctuations in species presence/absence (self-similar limit cycles) are the most common community outcome. The unique application of this Boolean network approach to the study of mutualistic community assembly offers a great opportunity to improve our understanding of these critical communities.
Conflict of interest statement
The authors declare no conflict of interest.
Figures
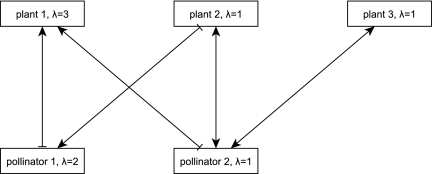
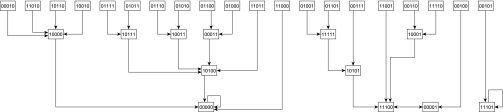
 is determined by the species that target it and are present at time t. Here, the effect of a negative edge is equal to that of a positive edge, and a species must have more active positive incoming edges than negative at time t to be present at time t + 1 (Materials and Methods). The 32 possible community states are identified with a binary number (present = 1, absent = 0) where the values correspond to (from left to right) plant 1, 2, 3 and pollinator 1, 2. Edges indicate the succession of the system's states in the absence of outside influence. The system admits two steady states, 00000 (presence of no species) and 11101 (absence only of pollinator 1), and one cycle of length 2, 11100 ↔ 00001 (the system oscillates between all plants and no pollinators and only pollinator 2). Note that due to the artificial nature of this example interaction network, this limit cycle is highly unrealistic, and such limit cycles are extremely uncommon in larger, more realistic interaction networks.
Similar articles
-
Distinct responses of antagonistic and mutualistic networks to agricultural intensification.Ecology. 2020 Oct;101(10):e03116. doi: 10.1002/ecy.3116. Epub 2020 Aug 7. Ecology. 2020. PMID: 32530504
-
Habitat loss alters the architecture of plant--pollinator interaction networks.Ecology. 2013 Dec;94(12):2688-96. doi: 10.1890/13-0977.1. Ecology. 2013. PMID: 24597216
-
Changes in species composition and community structure during plant-pollinator community assembly.Ecology. 2025 Jun;106(6):e70119. doi: 10.1002/ecy.70119. Ecology. 2025. PMID: 40470768 Free PMC article.
-
Impacts of plant invasions in native plant-pollinator networks.New Phytol. 2021 Jun;230(6):2117-2128. doi: 10.1111/nph.17339. Epub 2021 Apr 14. New Phytol. 2021. PMID: 33710642 Review.
-
Seeing through the static: the temporal dimension of plant-animal mutualistic interactions.Ecol Lett. 2021 Jan;24(1):149-161. doi: 10.1111/ele.13623. Epub 2020 Oct 19. Ecol Lett. 2021. PMID: 33073900 Review.
Cited by
-
Stabilization of perturbed Boolean network attractors through compensatory interactions.BMC Syst Biol. 2014 May 8;8:53. doi: 10.1186/1752-0509-8-53. BMC Syst Biol. 2014. PMID: 24885780 Free PMC article.
-
Modeling the building blocks of biodiversity.PLoS One. 2013;8(2):e56277. doi: 10.1371/journal.pone.0056277. Epub 2013 Feb 27. PLoS One. 2013. PMID: 23460797 Free PMC article.
-
Effect of localization on the stability of mutualistic ecological networks.Nat Commun. 2015 Dec 17;6:10179. doi: 10.1038/ncomms10179. Nat Commun. 2015. PMID: 26674106 Free PMC article.
-
Pleistocene megafaunal interaction networks became more vulnerable after human arrival.Proc Biol Sci. 2015 Sep 7;282(1814):20151367. doi: 10.1098/rspb.2015.1367. Proc Biol Sci. 2015. PMID: 26336175 Free PMC article.
-
Automated model refinement using perturbation-observation pairs.NPJ Syst Biol Appl. 2025 Jun 16;11(1):65. doi: 10.1038/s41540-025-00532-y. NPJ Syst Biol Appl. 2025. PMID: 40523884 Free PMC article.
References
-
- Ingram T, Harmon LJ, Shurin JB. Niche evolution, trophic structure, and species turnover in model food webs. Am Nat. 2009;174:56–67. - PubMed
-
- Bastolla U, Lässig M, Manrubia SC, Valleriani A. Biodiversity in model ecosystems, II: Species assembly and food web structure. J Theor Biol. 2005;235:531–539. - PubMed
-
- Law R, Morton RD. Permanence and the assembly of ecological communities. Ecology. 1996;77:762–775.
-
- Capitán JA, Cuesta JA, Bascompte J. Statistical mechanics of ecosystem assembly. Phys Rev Lett. 2009;103:168101. - PubMed
Publication types
MeSH terms
LinkOut - more resources
Full Text Sources
Research Materials
