. 2011 Jan 5;103(1):47-60.
doi: 10.1093/jnci/djq470. Epub 2010 Dec 20.

A novel epigenetic phenotype associated with the most aggressive pathway of bladder tumor progression

Affiliations

A novel epigenetic phenotype associated with the most aggressive pathway of bladder tumor progression

Céline Vallot et al. J Natl Cancer Inst. .

Abstract

Background: Epigenetic silencing can extend to whole chromosomal regions in cancer. There have been few genome-wide studies exploring its involvement in tumorigenesis.

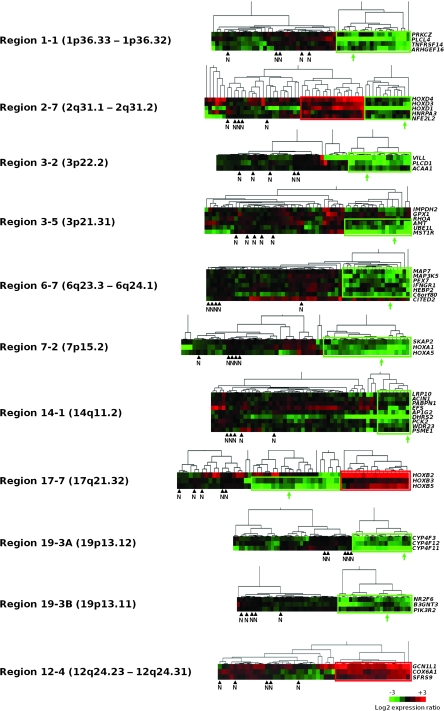
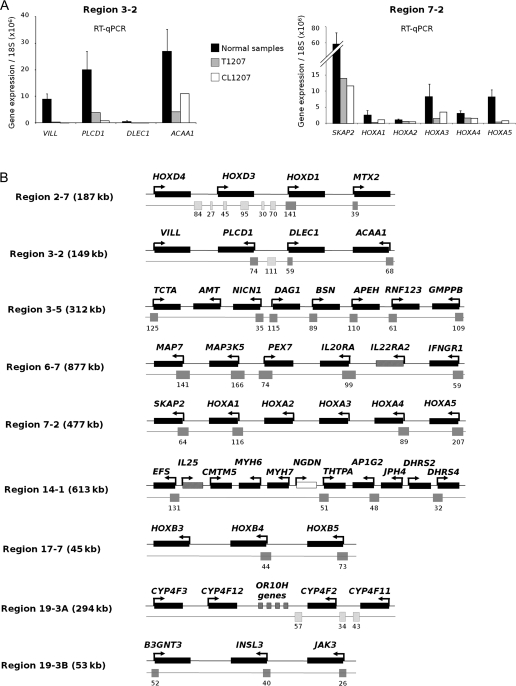
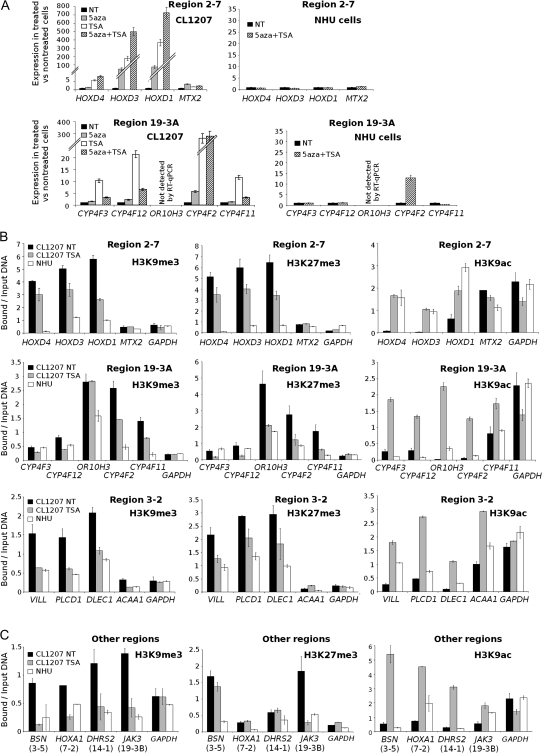
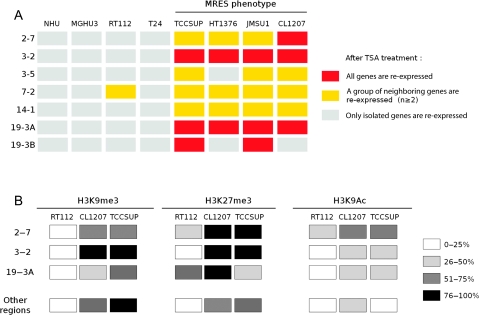
Methods: We searched for chromosomal regions affected by epigenetic silencing in cancer by using Affymetrix microarrays and real-time quantitative polymerase chain reaction to analyze RNA from 57 bladder tumors compared with normal urothelium. Epigenetic silencing was verified by gene re-expression following treatment of bladder cell lines with 5-aza-deoxycytidine, a DNA demethylating agent, and trichostatin A, a histone deacetylase inhibitor. DNA methylation was studied by bisulfite sequencing and histone methylation and acetylation by chromatin immunoprecipitation. Clustering was used to distinguish tumors with multiple regional epigenetic silencing (MRES) from those without and to analyze the association of this phenotype with histopathologic and molecular types of bladder cancer. The results were confirmed with a second panel of 40 tumor samples and extended in vitro with seven bladder cancer cell lines. All statistical tests were two-sided.

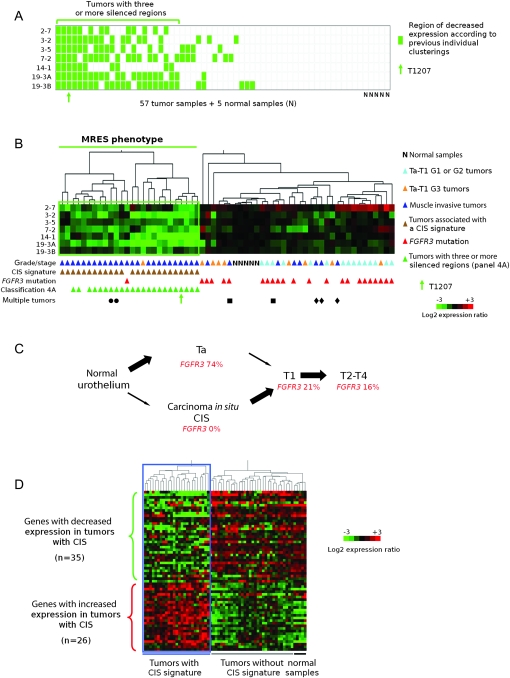
Results: We identified seven chromosomal regions of contiguous genes that were silenced by an epigenetic mechanism. Epigenetic silencing was not associated with DNA methylation but was associated with histone H3K9 and H3K27 methylation and histone H3K9 hypoacetylation. All seven regions were concordantly silenced in a subgroup of 26 tumors, defining an MRES phenotype. MRES tumors exhibited a carcinoma in situ-associated gene expression signature (25 of 26 MRES tumors vs 0 of 31 non-MRES tumors, P < 10⁻¹⁴), rarely carried FGFR3 mutations (one of 26 vs 22 of 31 non-MRES tumors, P < 10⁻¹⁶), and contained 25 of 33 (76%) of the muscle-invasive tumors. Cell lines derived from aggressive bladder tumors presented epigenetic silencing of the same regions.

Conclusions: We have identified an MRES phenotype characterized by the concomitant epigenetic silencing of several chromosomal regions, which, in bladder cancer, is specifically associated with the carcinoma in situ gene expression signature.


Figures

Figure 1
Figure 1
Clustering analyses to identify coordinated gene expression patterns independent of copy number changes in bladder tumors. For each of the 28 chromosomal regions that contained genes with correlated expression independent of copy number changes (11), tumors were subjected to hierarchical clustering based on gene expression levels. Each row represents such a gene, ordered according to its chromosomal position in the region, and each column represents a tumor or normal tissue sample. Only genes for which normal samples had a “present” signal according to the Affymetrix MAS5 algorithm were included. As shown in the color bar at the bottom of the figure, green indicates decreased expression, red indicates increased expression, and black indicates no change of gene expression, with respect to average expression in normal urothelium (n = 5). For each region, the subset of tumors with coordinately decreased gene expression in the region is boxed in green and the subset of tumors with coordinately increased gene expression is boxed in red. N indicates the position of the normal samples and the green arrows indicate the position of the T1207 bladder tumor from which the CL1207 cell line was derived. Different tumor expression patterns were identified among the 28 chromosomal regions containing genes with coordinated expression. Ten regions (shown here) (1-1, 2-7, 3-2, 3-5, 6-7, 7-2, 14-1, 17-7, 19-3A, and 19-3B) contained a subset of tumor samples with coordinated decreased expression. These regions were potentially affected by a regional epigenetic silencing mechanism. Two of the 10 regions (2-7 and 17-7) also contained a subset of tumors with coordinated increased expression. Although region 19-3 was initially identified as a single region (11), it was separated here into two regions (regions 19-3A and 19-3B) because we found that it comprised two well-spaced clusters of genes with decreased expression that were separated by several genes whose expression was not decreased in tumors compared to normal urothelium (data not shown). Among the 19 remaining regions, six presented a subset of tumors with coordinated increased expression (one of these six region, region 12-4 is shown) and 13 presented no clear expression pattern.
Figure 2
Figure 2
Further analysis of gene expression within the regions displaying decreased expression. A) Analysis of all the genes contained in regions 3-2 and 7-2 by real-time quantitative polymerase chain reaction (RT-qPCR). To confirm the Affymetrix data and to determine whether decreased expression affected stretches of contiguous genes, RT-qPCR was performed on RNA from the T1207 human bladder tumor, CL1207 (a cell line derived from T1207), and normal urothelial samples (n = 4). Expression was determined for all the genes in these regions, including the genes not present on the Affymetrix array. Experiments were done in duplicate, in a TaqMan low-density array format, and expression levels were normalized relative to 18S ribosomal RNA. The histograms reflect the mean value of the duplicates. For normal samples, the error bars indicate the 95% confidence intervals for four independent samples. For additional data for all other regions, see Supplementary Figure 1, available online. B) Summary of RT-qPCR data for the nine regions containing stretches of genes with decreased expression. Experiments were done with RNA from tumor T1207 and its derived cell line, CL1207 (as shown in [A] and Supplementary Figure 1, available online). Stretches were defined by three or more consecutive genes with decreased expression in T1207 and CL1207 (ratio to average expression in normal samples <0.5). Genes that were not expressed were included in these stretches. Genes are ordered according to their chromosomal locations; their names, the orientation of transcription (shown with arrows), and the size of the regions are indicated. Genes with decreased expression are represented by a black rectangle, genes that were not expressed are indicated with a hatched rectangle and genes with no change in expression with respect to normal samples are indicated with a white rectangle. All of the CpG islands that overlap a gene promoter are shown below the genes (gray rectangles), and the numbers of CpG dinucleotides contained in the CpG islands are indicated. CpG islands that do not overlap promoters are shown for regions 2-7, 3-2, and 19-3A (hatched rectangles) because they were also used for methylation analyses.
Figure 3
Figure 3
Epigenetic silencing mechanisms in regions of decreased expression. A) Effect of 5-aza-deoxycytidine (5aza) and TSA treatments on gene expression in CL1207 human bladder tumor cells vs normal human urothelial (NHU) cells. Gene expression was measured by real-time quantitative polymerase chain reaction (RT-qPCR) in RNA from CL1207 cells before (NT) and after treatment with the DNA demethylating agent 5aza, the histone deacetylase inhibitor TSA, or both and in RNA from NHU cells before (NT) and after treatment with both 5aza and TSA. Results are shown for two regions, region 2-7 (upper panels) and region 19-3A (lower panels) (for additional data for all other regions, see Supplementary Figure 2, available online). For each treatment, RT-qPCR analyses were performed in two independent experiments, with each qPCR performed in duplicate. Results are expressed as the ratio between expression in treated cells and in untreated cells. The error bars indicate the variance between the means of the two independent experiments. Treatments were scored as having an effect if there was a greater than 1.5-fold change between treated and untreated cells. B) Histone marks in regions 2-7, 19-3A, and 3-2 in chromatin from CL1207 cells in the presence or absence of TSA treatment and from untreated NHU cells. Histone marks associated with the promoters of silenced genes (H3K9me3 and H3K27me3) or expressed genes (H3K9Ac) were investigated by chromatin immunoprecipitation (ChIP) assays. ChIP assays were performed for all promoters in regions 2-7 (upper panels), 19-3A (middle panels) and 3-2 (lower panels), using antibodies against posttranslational modifications of histone H3: trimethyl lysine 9 (H3K9me3; left panels), trimethyl lysine 27 (H3K27me3; middle panels) and acetyl lysine 9 (H3K9ac; right panels). The bar graph shows the amount of immunoprecipitated target DNA, expressed as a percentage of total input DNA, measured in duplicate by qPCR. Levels of H3K9me3 and H3K27me3 in the promoter of the ubiquitously expressed GAPDH gene served as a negative control in chromatin from both cell types. The error bars indicate the variance between the means of two independent experiments. C) Histone marks in regions 3-5, 7-2, 14-1, and 19-3B in chromatin from TSA-treated or untreated CL1207 cells and from untreated NHU cells. In all other regions that presented a stretch of coordinately silenced genes that were re-expressed after TSA or 5aza treatment, experiments were done as in (B) except that ChIP assays were performed for only one gene promoter per region (eg, the promoter of BSN for region 3-5, HOXA1 for region 7-2, DHRS2 for region 14-1, and JAK3 for region 19-3B).
Figure 4
Figure 4
Presence of a multiple regional epigenetic silencing (MRES) phenotype in bladder cancer and its relationship to the two pathways of bladder tumor progression. A) Determination of the number of epigenetically silenced regions for each tumor in the set of 57 bladder tumors. This panel was deduced from the cluster analysis data in Figure 1 for each of the seven epigenetically controlled regions (regions 2-7, 3-3, 3-5, 7-2, 14-1, 19-3A, and 19-3B). Each row represents a chromosomal region, and each column a tumor or normal sample. For each tumor, decreased expression of a given chromosomal region (ie, placement within the green box in Figure 1) is denoted by a green rectangle, whereas equal or increased expression is denoted by a white rectangle. Twenty-three tumors (those below the horizontal green line) displayed decreased expression of at least three regions. The position of tumor T1207 is indicated by a green arrow. B) Cluster analysis of 57 tumor samples and five normal samples according to the level of gene expression in the seven epigenetically silenced regions. Samples are clustered according to their regional expression scores, which correspond to the average levels of gene expression in each region (see “Methods”). Tumors that displayed decreased expression in several regions (below the horizontal green line) define a MRES phenotype. All samples are annotated with their stage and grade, presence or absence of a carcinoma in situ (CIS)-associated gene expression signature (Figure 4, D) and their FGFR3 mutation status. Tumors that had at least three chromosomal regions with decreased gene expression in Figure 4, A are also indicated. The tumors from the three patients with multiple tumors are indicated by three different symbols. The patient indicated by a circle had two synchronous T3-G3 tumors. The patient indicated by a square had one T2-G2 primary tumor and then a T1-G2 tumor. The patient indicated by a diamond had three synchronous T4-G3 tumors. The cluster analysis was not affected by the exclusion of regional expression scores for tumors displaying genetic loss in the corresponding region (data not shown). C) Schematic representation of the two pathways of bladder cancer progression. In bladder cancer, two different pathways can lead to invasive tumors: the superficial Ta tumor pathway, which rarely leads to progression, and the CIS pathway, in which the superficial lesions (CIS) are high grade and very often progress to lamina propria–invasive T1 and then to muscle-invasive T2-T4 tumors (29). The percentages of FGFR3 mutations at the different stages of tumor progression in the two pathways are taken from reference (30). D) Separation of the 57 bladder tumors according to the CIS-associated gene expression signature previously defined by Dyrskjøt et al. (31). Sixty-one of the 100 genes reported by Dyrskjøt et al. were represented on the Affymetrix array used (U95A). Of these 61 genes, 26 corresponded to genes with increased expression and 35 to genes with decreased expression in bladder cancers that had the CIS-associated signature compared with those that did not (31). The 62 samples (57 tumor samples and five normal urothelial samples) clustered into two groups with respect to the CIS-associated gene expression signature.
Figure 5
Figure 5
The multiple regional epigenetic silencing (MRES) phenotype in bladder cancer cell lines. A) Summary of the effect of TSA treatment on gene expression in the epigenetically silenced regions in bladder cancer and normal urothelial cells in culture. A gene was considered to be re-expressed if its expression level changed 1.5-fold or more between treated and untreated cells (for original data, see Supplementary Figure 6, available online). A region was considered to be re-expressed if at least two neighboring genes were re-expressed after treatment: a yellow box indicates that a group of at least two neighboring genes were re-expressed, whereas a red box indicates that all genes were re-expressed. A cell line was considered to present the MRES phenotype if most of the regions were re-expressed following TSA treatment. B) Summary of the changes in histone marks in the epigenetically silenced regions in MRES and non-MRES tumor cell lines. This panel summarizes the changes in histone marks associated with the promoter of inactive (H3K9me3 and H3K27me3) and active (H3K9Ac) genes for the different regions in two cell lines presenting the MRES phenotype (TCCSUP and CL1207) and one cell line without the MRES phenotype (RT112) compared with NHU cells. The histone marks were assessed by chromatin immunoprecipitation, with specific antibodies directed against the different marks (for original data, see Figure 3, B and C and Supplementary Figure 7, available online). All gene promoters were studied within regions 2-7, 3-2, and 19-3A and one gene promoter per region was studied for all the other regions (the promoter of BSN for region 3-5, HOXA1 for region 7-2, DHRS2 for region 14-1 and JAK3 for region 19-3B). For each cell line, the histone marks of the promoters of the genes within the different regions were compared with the histone marks found at the same promoter in NHU cells. Within each region and for each cell line and histone mark, we have indicated the percentage of promoters with a histone mark that is modified compared with the corresponding site in NHU cells. The inactive marks (H3K9me3 and H3K27me3) were scored as being modified if we observed a twofold increase in modification at the same position in the promoter in the tumor cell line, as compared with NHU cells. For the active mark (H3K9ac), we scored the mark as modified if the mark displayed a more than twofold decrease.

References

    1. Jones PA, Baylin SB. The fundamental role of epigenetic events in cancer. Nat Rev Genet. 2002;3(6):415–428. - PubMed
    1. Laird PW. Cancer epigenetics. Hum Mol Genet. 2005;14(Spec No 1):R65–R76. - PubMed
    1. Jones PA, Baylin SB. The epigenomics of cancer. Cell. 2007;128(4):683–692. - PMC - PubMed
    1. Esteller M. Cancer epigenomics: DNA methylomes and histone-modification maps. Nat Rev Genet. 2007;8(4):286–298. - PubMed
    1. Gibbons RJ. Histone modifying and chromatin remodelling enzymes in cancer and dysplastic syndromes. Hum Mol Genet. 2005;14(Spec No 1):R85–R92. - PubMed

Publication types

MeSH terms