. 2011:3:114-28.
doi: 10.1093/gbe/evq086. Epub 2010 Dec 20.

Effective population size and the efficacy of selection on the X chromosomes of two closely related Drosophila species

Affiliations

Effective population size and the efficacy of selection on the X chromosomes of two closely related Drosophila species

Peter Andolfatto et al. Genome Biol Evol. 2011.

Abstract

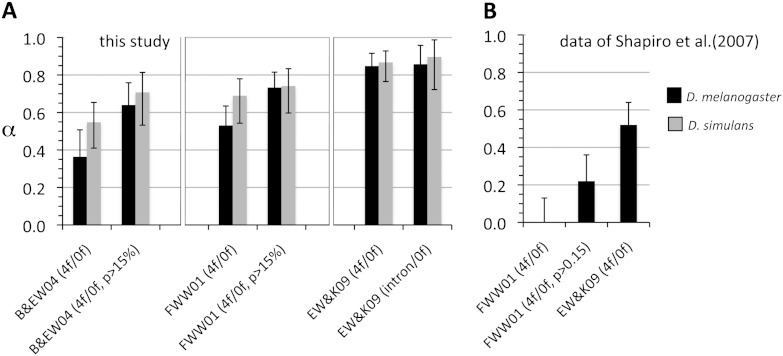
The prevalence of natural selection relative to genetic drift is of central interest in evolutionary biology. Depending on the distribution of fitness effects of new mutations, the importance of these evolutionary forces may differ in species with different effective population sizes. Here, we survey population genetic variation at 105 orthologous X-linked protein coding regions in Drosophila melanogaster and its sister species D. simulans, two closely related species with distinct demographic histories. We observe significantly higher levels of polymorphism and evidence for stronger selection on codon usage bias in D. simulans, consistent with a larger historical effective population size on average for this species. Despite these differences, we estimate that <10% of newly arising nonsynonymous mutations have deleterious fitness effects in the nearly neutral range (i.e., -10 < N(e)s < 0) in both species. The inferred distributions of fitness effects and demographic models translate into surprisingly high estimates of the fraction of "adaptive" protein divergence in both species (∼ 85-90%). Despite evidence for different demographic histories, differences in population size have apparently played little role in the dynamics of protein evolution in these two species, and estimates of the adaptive fraction (α) of protein divergence in both species remain high even if we account for recent 10-fold growth. Furthermore, although several recent studies have noted strong signatures of recurrent adaptive protein evolution at genes involved in immunity, reproduction, sexual conflict, and intragenomic conflict, our finding of high levels of adaptive protein divergence at randomly chosen proteins (with respect to function) suggests that many other factors likely contribute to the adaptive protein divergence signature in Drosophila.


Figures

F<sc>IG</sc>. 1.—
FIG. 1.—
Levels of diversity at orthologous loci in D. melanogaster and D. simulans. Locus by locus estimates of (A) average pairwise diversity, π, and (B) the population mutation rate, θ. Panels A and B show P-values for the hypothesis that Dmel=Dsim using Wilcoxon Matched-pairs Signed ranks tests. Filled circles indicate 4-fold synonymous sites (Syn4f, 105 loci) and grey squares indicate short introns (21 loci). In both cases, diversity estimates are significantly positively correlated in the two species (two-tailed Spearman Rank Correlation test P-values are given in panel A). C. Lineage-specific 4-fold synonymous divergence (ds_4f, open circles) is not strongly correlated between species. Lineage-specific 0-fold nonsynonymous divergence (dn_0f, filled circles) is strongly correlated in the two species. P-values are from two-tailed Spearman Rank correlation tests. D. Synonymous site diversity (π) is negatively correlated with nonsynonymous divergence per site (dn) in both species (Dmel, filled circles; Dsim, open boxes). Synonymous site diversity estimates (π) have been corrected for ds using partial regression (Andolfatto 2007). The lines (black = Dmel; grey = Dsim) indicate a lowess fit to the data and P-values are from two-tailed Spearman Rank correlation tests.
F<sc>IG</sc>. 2.—
FIG. 2.—
The inferred distribution of fitness effects of newly arising nonsynonymous mutations in the D. melanogaster (Dmel) and D. simulans (Dsim) lineages. The reference sites used for demographic inference are given in parentheses. Values in each category of Ne are calculated by integrating a gamma distribution with parameters in Supplement S2.1, where Ne is the weighted average of population size along the lineage. The estimates of Keightley and Eyre-Walker (2007) using the Zimbabwe subsample of D. melanogaster data of Shapiro et al. (2007) are shown for comparison (white bars). 95% confidence limits are based one 200 replicate bootstraps of the data by locus with replacement (see Methods).
F<sc>IG</sc>. 3.—
FIG. 3.—
Estimates of the fraction of nonsynoymus divergence excess relative to neutral expectations (a) in the D. melanogaster (black) and D. simulans (gray) lineages. B&EW: method of Bierne & Eyre-Walker (2004); FWW01: method of Fay et al. (2001); EW&K09: method of Eyre-Walker and Keightley (2009); 4f: four-fold synonymous sites; 0f: nondegenerate nonsynonymous sites; intron: short introns. The Keightley and Eyre-Walker (2007) estimates for the Zimbabwe subsample of the Shapiro et al. (2007) data set are shown in panel B. Note that the latter estimates use D. melanogaster–D. simulans divergence, rather than lineage-specific divergence.
F<sc>IG</sc>. 4.—
FIG. 4.—
Analysis of 4-fold synonymous sites by codon change class. (A) Relative diversity in the two species. Paired Wilcoxon test P-value levels of equal diversity in Dmel and Dsim (dashed line) are: *P<2e-4; **P<2e-5; ***P<2e-7. (B) The ratio of divergence to polymorphism (D/P). Mantel-Haenzel test (with continuity correction) P-values versus the UU+PP (no change) class are P=8.5e-5 for Dmel and P=2.2e-6 for Dsim. All of the same patterns are evident when all synonymous sites are used (not shown).
F<sc>IG</sc>. 5.—
FIG. 5.—
The effect of weak selection on the expected relative levels of diversity in two species with different population sizes. The x-axis corresponds to the intensity of selection in the species with the smaller population size (N1). The Y-axis plots expected relative levels of diversity in the two species. In red and purple are relative θW and π, respectively, in species with a 1.5-fold difference in population size. In blue and green are analogous expectations for a 2-fold difference in population size. Graphs are based on simulations of the Poisson Random Field model (Sawyer and Hartl 1992) using code kindly provided by C. Bustamante.

References

    1. Akashi H. Inferring weak selection from patterns of polymorphism and divergence at “silent” sites in Drosophila DNA. Genetics. 1995;139:1067–1076. - PMC - PubMed
    1. Akashi H. Molecular evolution between Drosophila melanogaster and D. simulans: reduced codon bias, faster rates of amino acid substitution, and larger proteins in D. melanogaster. Genetics. 1996;144:1297–1307. - PMC - PubMed
    1. Akashi H, Schaeffer S. Natural selection and the frequency distributions of “silent” DNA polymorphism in Drosophila. Genetics. 1997;146:295–307. - PMC - PubMed
    1. Andolfatto P. Contrasting patterns of X-linked and autosomal nucleotide variation in Drosophila melanogaster and Drosophila simulans. Mol Biol Evol. 2001;18:279–290. - PubMed
    1. Andolfatto P. Adaptive evolution of non-coding DNA in Drosophila. Nature. 2005;437:1149–1152. - PubMed

Publication types