

Review
doi: 10.1021/cr100370n.
Epub 2010 Dec 21.
Peptide signaling in the staphylococci
Affiliations
- PMID: 21174435
- PMCID: PMC3086461
- DOI: 10.1021/cr100370n
Item in Clipboard
Review
Peptide signaling in the staphylococci
Chem Rev.
.
No abstract available
Figures
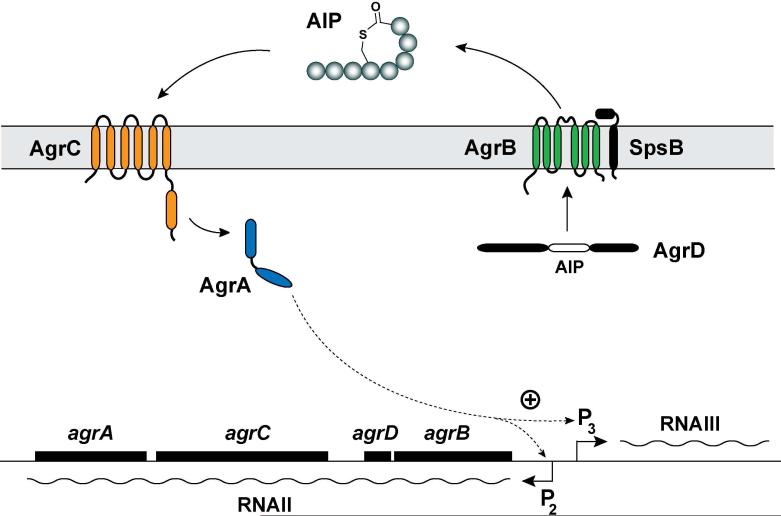
Schematic of the agr system in Staphylococci. The locus is composed of two divergent transcripts called RNAII and RNAIII, driven by the P2 and P3 promoters, respectively. The RNAII transcript is an operon of four genes, agrBDCA, which encodes the core machinery of the system. AgrD is the peptide precursor and is processed and exported through AgrB and SpsB action at the cytoplasmic membrane. SpsB is the house-keeping type I signal peptidase. At the threshold concentration, autoinducing peptide (AIP) binds to the AgrC receptor, a membrane-bound histidine kinase. AIP binding activates the AgrC kinase, resulting in phosphorylation of the AgrA response regulator and activation of the P2 and P3 promoters. AgrA also activates the PSMα and PSMβ promoters (not shown). This figure is an adaption of the version reported by Thoendel et al.. Reprinted with permission from reference . Copyright 2009 The American Society for Biochemistry and Molecular Biology, Inc.
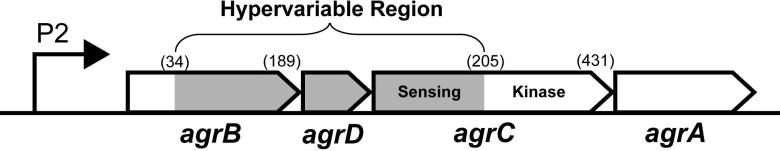
Hypervariable region of the agrBDCA operon. White areas represent highly conserved sections of genes. The gray regions mark where residue changes have occurred to establish different AIPs (AgrD), group-specific AIP processing (AgrB) and group-specific receptor recognition (AgrC). Numbers in parentheses indicate amino acid residue numbers marking the border of the variable regions.
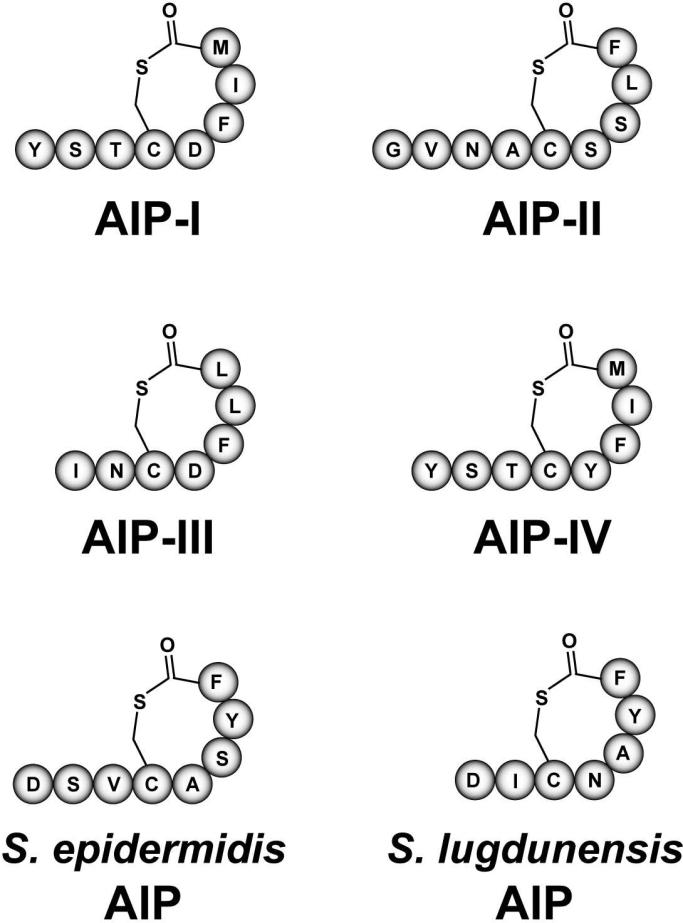
Structures of staphylococcal autoinducing peptides (AIPs). The four S. aureus AIPs representing agr Types I-IV are shown. The most common S. epidermidis (Type I) AIP and the predicted structure of the S. lugdunensis AIP are also shown.
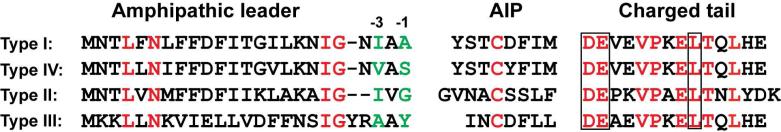
S. aureus AgrD sequences and domains. The four S. aureus AgrDs are aligned and separated into three domains that include an N-terminal amphipathic leader, AIP region, and C-terminal charged tail. Conserved resides across the four sequences are shown in red. Potential -1 and -3 signal peptidase cleavage sites are shown in green. Boxed residues in the C-terminal tail are essential for AgrB endopeptidase activity and AIP production.
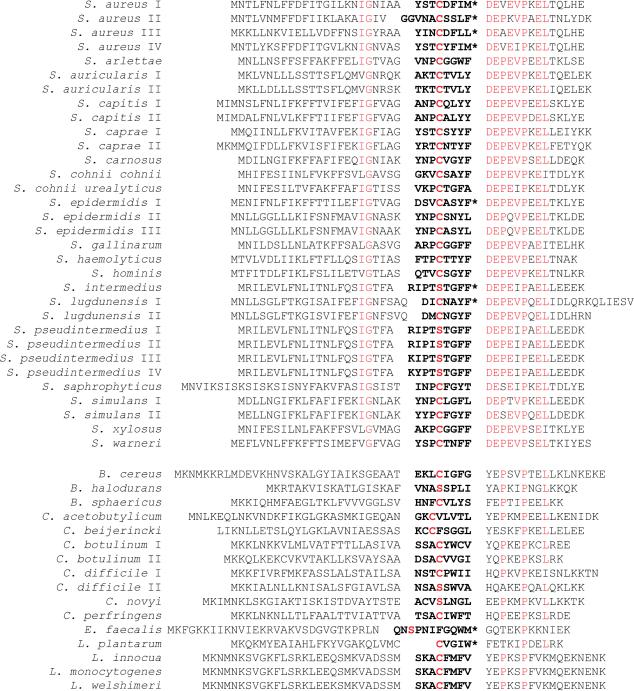
Sequence alignments of AgrD. Known AgrD sequences from various Gram-positive species are aligned and split into three sections that consist of an N-terminal leader, central AIP sequence (bolded), and charged C-terminal tail. Residues showing strong sequence conservation are colored red. AgrD's whose final AIP product has been confirmed are marked with an asterisk and all others are depicted as eight residues by default, except for variants from within the same species with known structures. Species type numbers reflect variants as reported by Dufour et al..
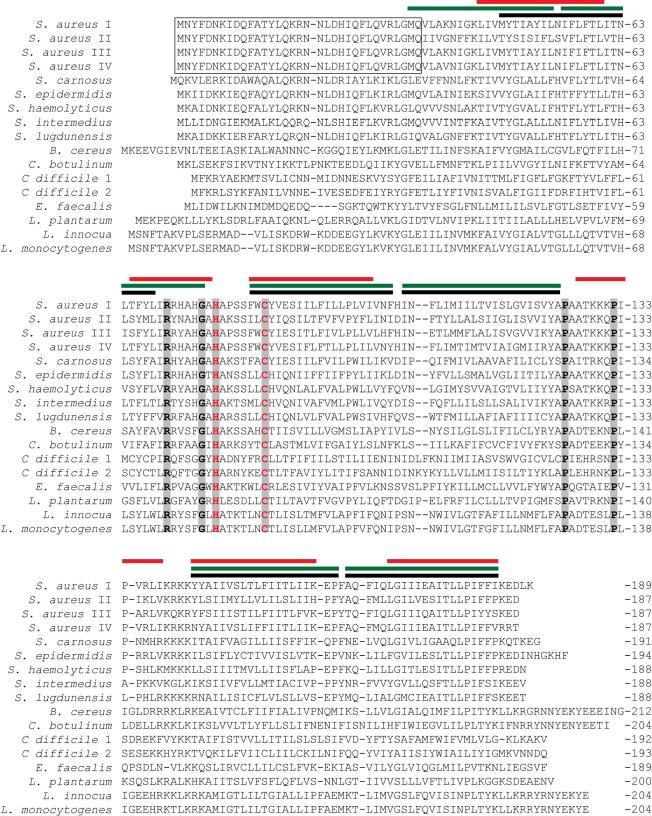
Sequence alignments of AgrB. AgrB sequences from selected Gram-positive species were aligned using ClustalW. Conserved residues are marked with gray boxes, and the essential histidine and cysteine residues are colored red. The colored lines above the sequence represent transmembrane regions as reported by Zhang et al. (red) or predicted using TOPCONs (green and black bars represent the two most common predictions). The 34 N-terminal residues conserved among S. aureus agr types are boxed.
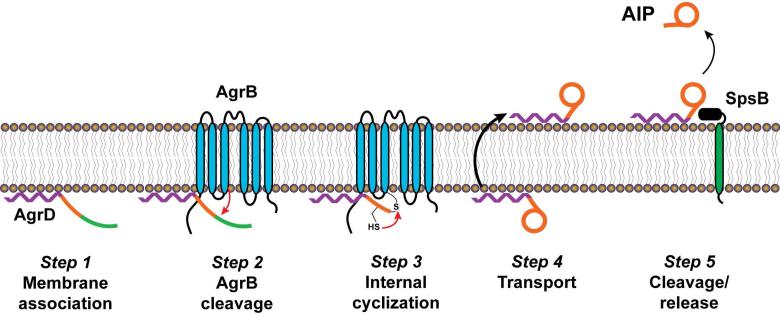
Model of AIP biosynthetic pathway. Step 1, AgrD is targeted to the cell membrane via its N-terminal amphipathic helix. Step 2, AgrB associates with AgrD and carries out a nucleophilic attack to remove the C-terminal domain of AgrD, resulting in formation of an AgrB-AgrD intermediate linked by a thioester bond. Step 3, the cysteine residue within the AIP-encoding portion of AgrD carries out a thioester exchange to form the thiolactone ring and release the AIP precursor from AgrB. Step 4, transport of the AIP precursor across the membrane, presumably by AgrB. Step 5, removal of the AgrD N-terminal domain by SpsB and release of the final AIP. This figure is an adaption of the version reported by Thoendel et al.. Reprinted with permission from reference . Copyright 2009 The American Society for Biochemistry and Molecular Biology, Inc.
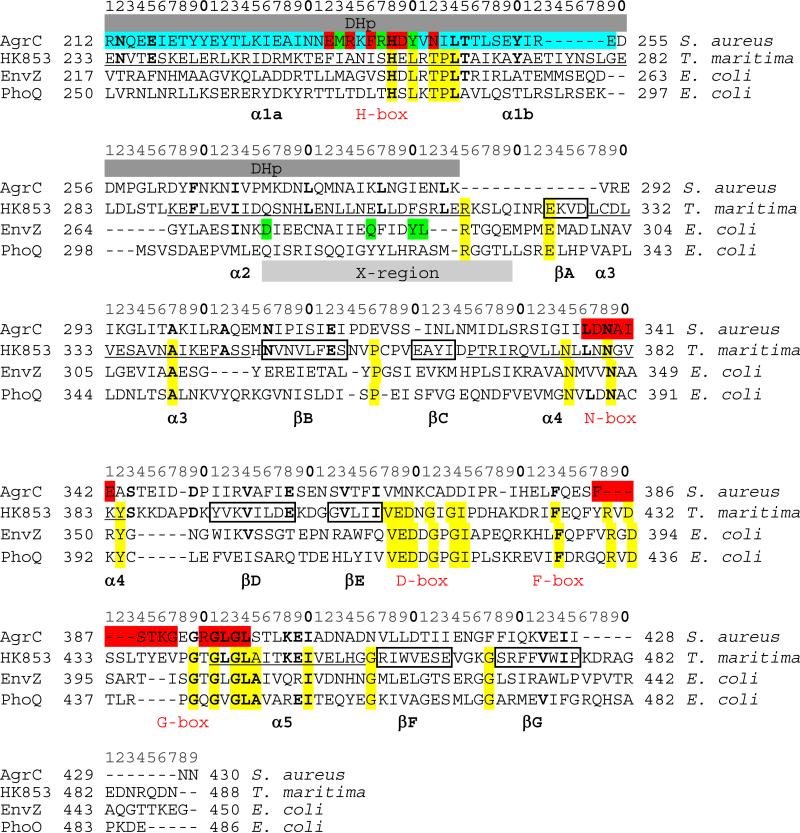
Alignments of cytoplasmic domains of HPKs. PHYRE was used to align the sequence of AgrC-I, HK853 from Thermotoga maritima, and EnvZ and PhoQ from E. coli. Residues that are highly conserved in HPK10's are highlighted in red and residues that are highly conserved in HK853, EnvZ and PhoQ are highlighted in yellow. AgrC-I residues highlighted in blue have a high propensity for coiled-coil formation, and AgrC-I residues highlighted in green are positions where mutations result in constitutive activity. EnvZ residues highlighted in green are positions where mutations eliminate phosphatase activity without altering autokinase activity. Underlined HK853 residues are within α-helices and boxed HK853 residue are within β-strands. The locations of the DHp subdomain and the X-region are indicated. Protein and bacteria names as well as specific residue numbering are indicated in the margins, and a residue count line is provided at the top of each panel.
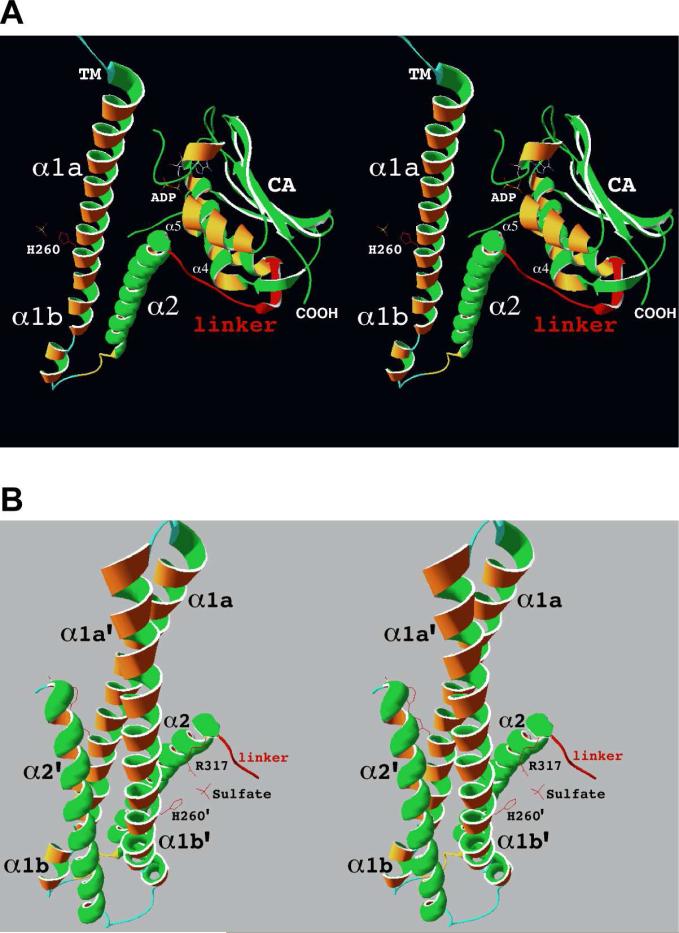
Structure of the cytoplasmic domain of HK853 from Thermotoga maritima. A. Stereo diagram of HK853 drawn with Swiss-PDB Viewer and PDB entry 2C2A. Inter-subdomain and βA residues that are predicted to be deleted in the cytoplasmic domains of HPK10's are drawn in red. The side chain of phosphoaccepting His260 also is shown in red extending from α-helix β1a of the DHp subdomain helical-hairpin located at the far left of the figure. B. Stereo diagram of the four-helix bundle formed by the helical-hairpins from the DHp subdomains of two HK853 monomers. The side chains of phosphoaccepting His260’ and Arg317, as well as an ordered sulfate ion are drawn in red.
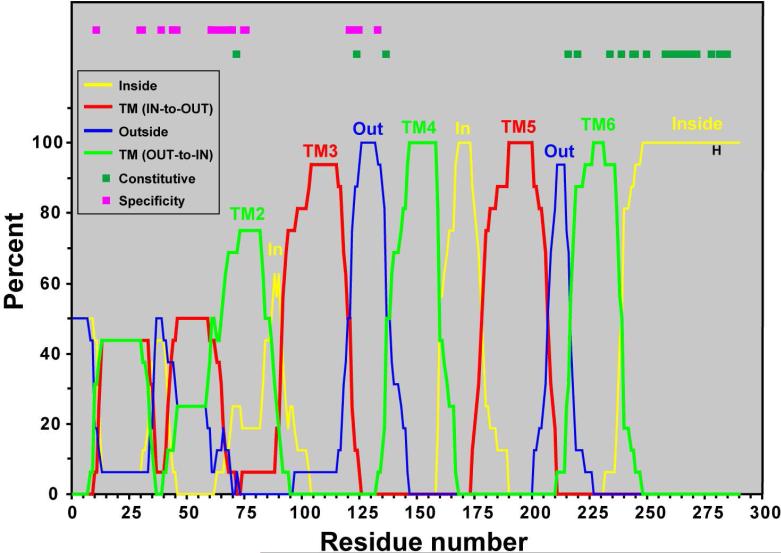
Consensus HPK10 topology plot. TOPCONS residue topologies were determined for each HPK10 family member (see Fig. S2). The frequency of a particular topology at each residue is plotted as a percentage versus residue number. Labeling on the plot is as follows: outside, thin blue line; TMOUT-to-IN, thick green line; inside, thin yellow line; TMIN-to-OUT, thick red line). TM is an abbreviation for transmembrane. Across the top of the plot, boxes indicate residue mutations in HPK's that result in constitutive activity (dark green) or ligand specificity (magenta).
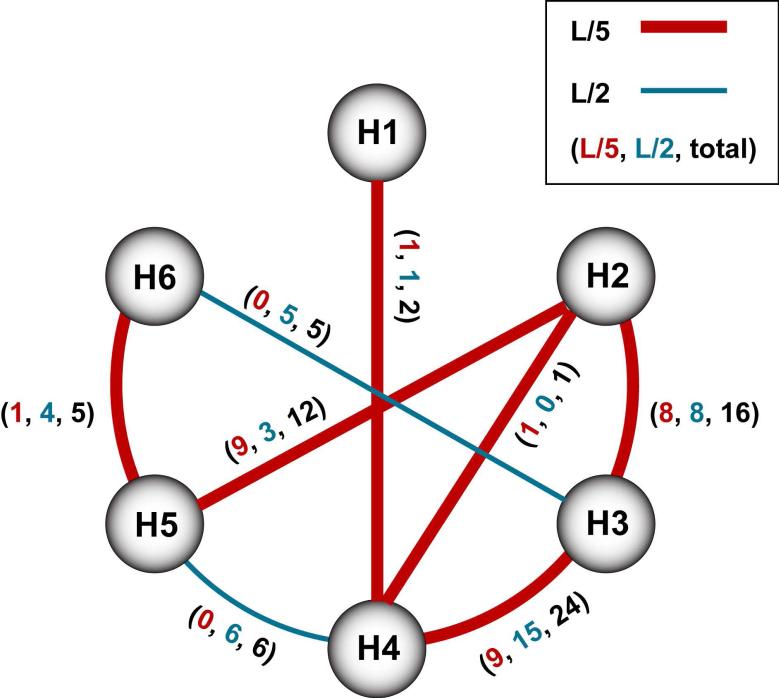
Helix-Helix interaction map for AgrC-I. TMHit generated transmembrane (TM) helices are indicated as circles and numbered according to AgrC-I topology. Interactions between the helices are indicated by the lines (or arcs). The presence of a line/arc indicates that at least one predicted atomic interaction pair exists between the helices, and the absence of a line/arc means that the program predicts no contact pairs. An interaction pair is defined as a pair of residues that have at least one pair of atoms that are separated by less than the sum of their van der Waals radii plus 0.6 Å. Contact pairs can be predicted at a higher confidence level (called “L/5” and depicted by thick, red lines/arcs) or at a lower confidence level (called “L/2” and depicted by thin, blue lines). Next to each lines/arcs are three numbers listed in parentheses, and these numbers are TMHit predicted interaction pairs in order of high confidence, low confidence, and total.
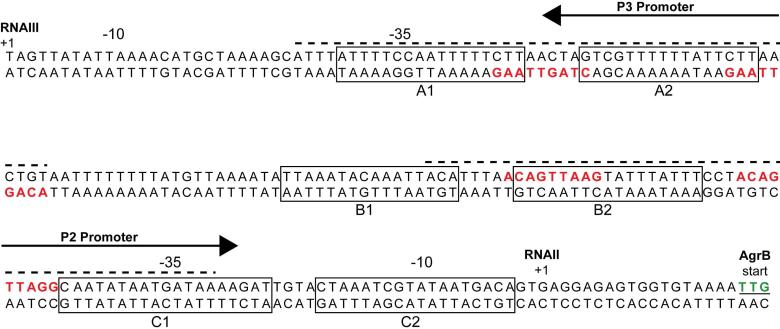
The agr P2-P3 intergenic region. RNAII and RNAIII transcriptional start sites are marked with a +1. Direct repeats recognized by AgrA are colored red while areas protected from DNaseI cleavage by AgrA are indicated with a dashed line above the sequence. Boxes indicate SarA binding sites as reported by Rechtin et al..
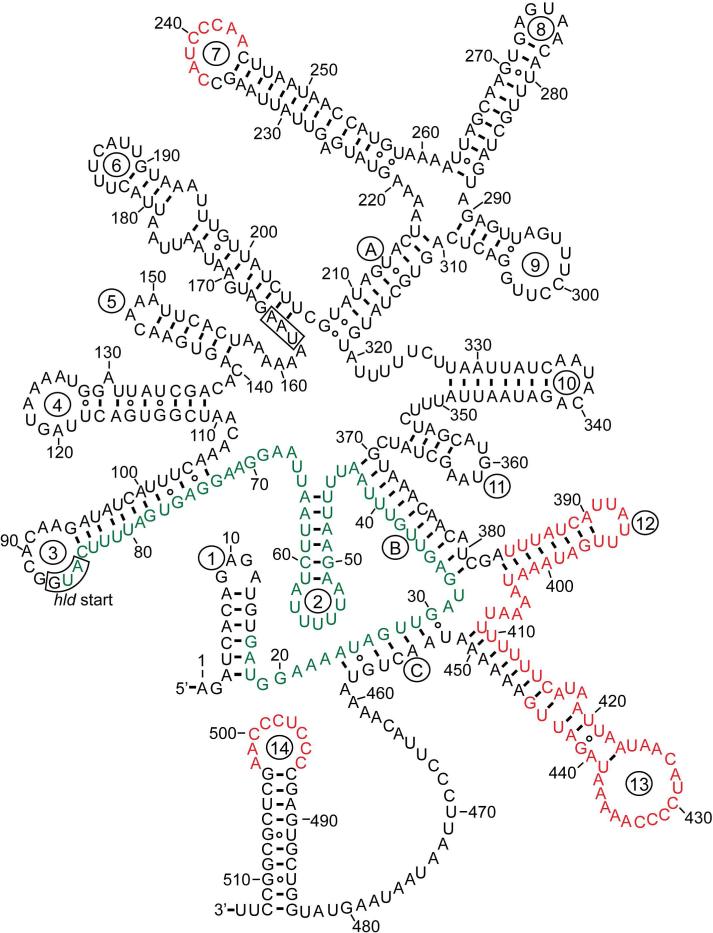
Secondary structure of S. aureus RNAIII. RNAIII hairpins are designated with circled numbers while letters signify long range interactions that establish general domains. hld start and stop codons are boxed. Nucleotides that basepair with and activate hla translation are colored green. Nucleotides demonstrated to inhibit translation of genes are red. This figure is an adaptation from Benito et al.. Reprinted with permission from Reference . Copyright 2000 Cold Spring Harbor Laboratory Press.
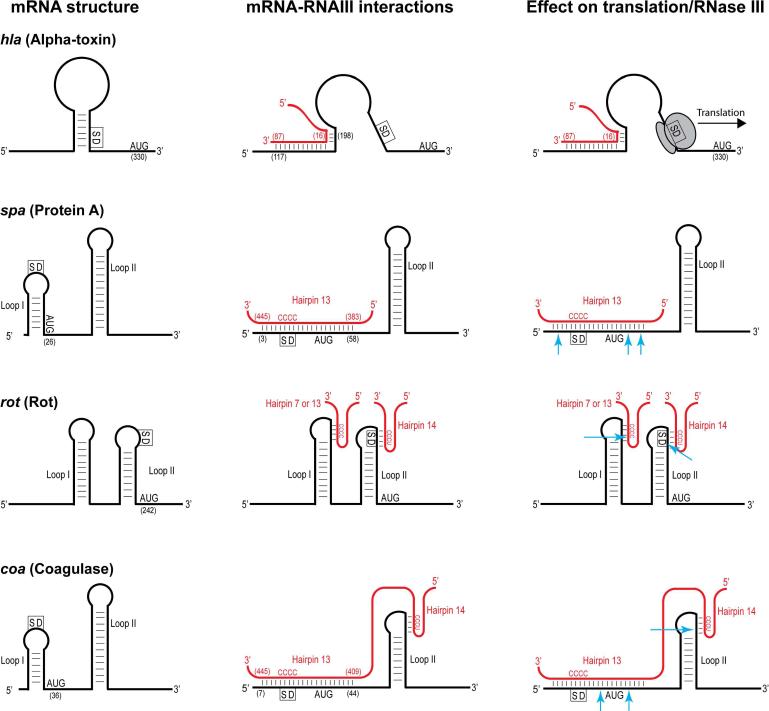
RNAIII mechanisms of post-transcriptional regulation on hla, spa, rot, and coa. RNAIII activates hla translation by disrupting the stem-loop and allowing ribosomes to access the Shine-Dalgarno (SD) sequence. RNAIII inhibits the translation of genes (spa, rot, and coa) by basepairing with the mRNA, blocking recognition of the SD sequence, and promoting RNaseIII cleavage. Targeted mRNAs are shown in black while RNAIII sections are red. Numbers reflect nucleotide position from 5’ end of transcripts. Blue arrows indicate sites of cleavage by RNaseIII.
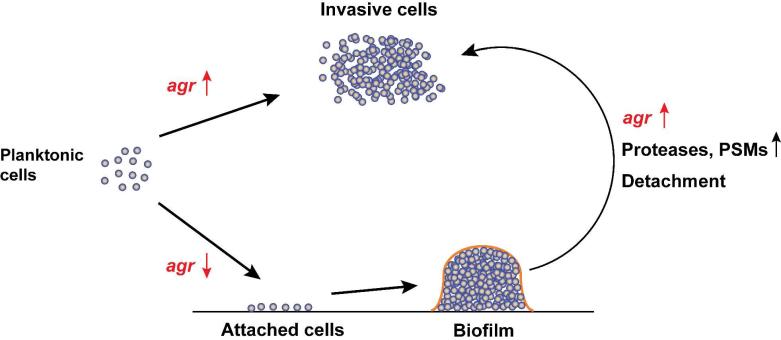
Schematic of the S. aureus agr system as a regulator of biofilm lifestyle. Under normal conditions with a functional agr system, S. aureus will secrete invasive factors and remain planktonic. When the agr system is inhibited or deactivated, S. aureus will preferentially adhere to surfaces and develop a biofilm if growth conditions permit. If the situation reverses in the biofilm and the agr system reactivates, the cells can detach in a protease and PSM-dependent manner and return to the planktonic state. It is important to note this schematic is based on the results of in vitro experiments and has not been confirmed in vivo.
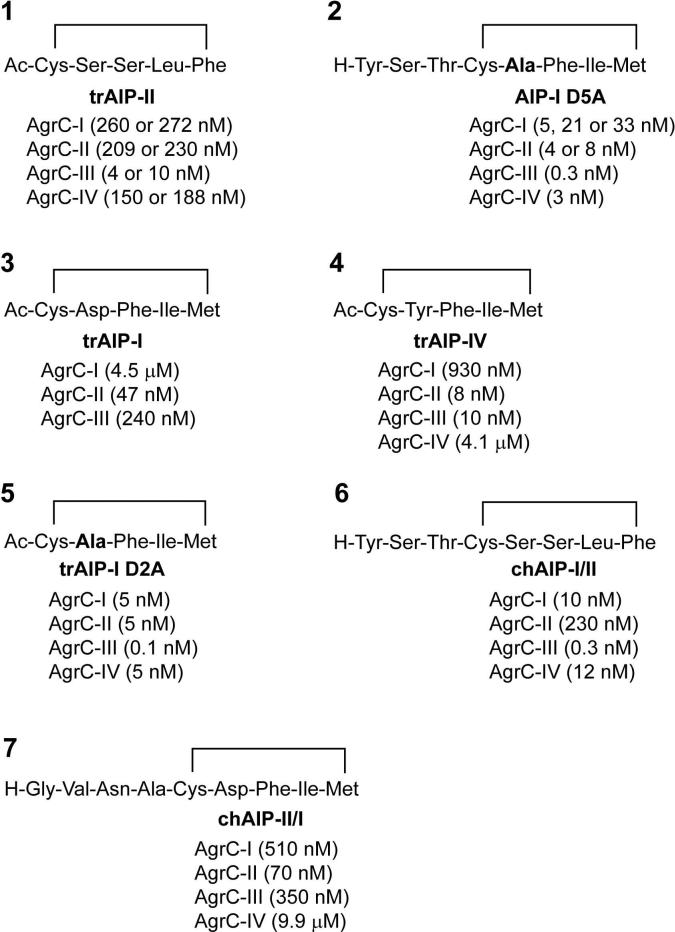
Global antagonists of S. aureus AgrC. Seven antagonists are shown based on SAR studies of the AIPs. IC50 values from S. aureus reporter strains for each AgrC type are shown underneath the structure.
References
Publication types
MeSH terms
Substances
Grants and funding
LinkOut - more resources
Full Text Sources
Other Literature Sources
Molecular Biology Databases
