. 2011 Feb 17;364(7):627-37.
doi: 10.1056/NEJMoa1006312. Epub 2010 Dec 22.

NFKBIA deletion in glioblastomas

Affiliations

NFKBIA deletion in glioblastomas

Markus Bredel et al. N Engl J Med. .

Abstract

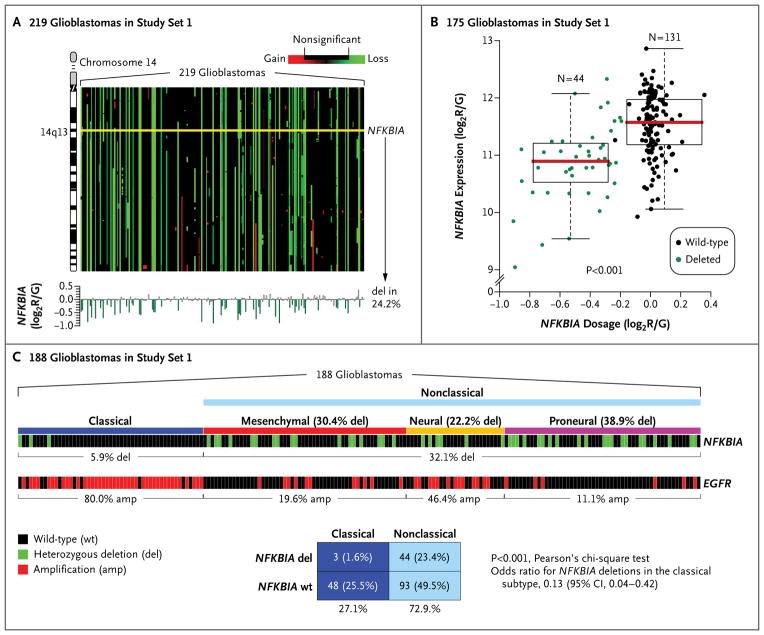
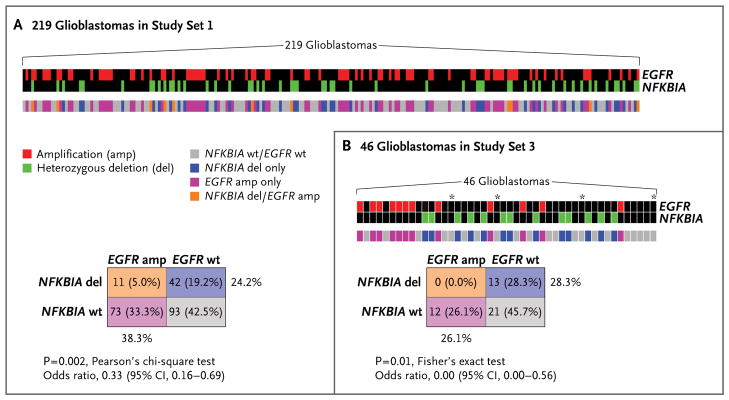
Background: Amplification and activating mutations of the epidermal growth factor receptor (EGFR) oncogene are molecular hallmarks of glioblastomas. We hypothesized that deletion of NFKBIA (encoding nuclear factor of κ-light polypeptide gene enhancer in B-cells inhibitor-α), an inhibitor of the EGFR-signaling pathway, promotes tumorigenesis in glioblastomas that do not have alterations of EGFR.

Methods: We analyzed 790 human glioblastomas for deletions, mutations, or expression of NFKBIA and EGFR. We studied the tumor-suppressor activity of NFKBIA in tumor-cell culture. We compared the molecular results with the outcome of glioblastoma in 570 affected persons.

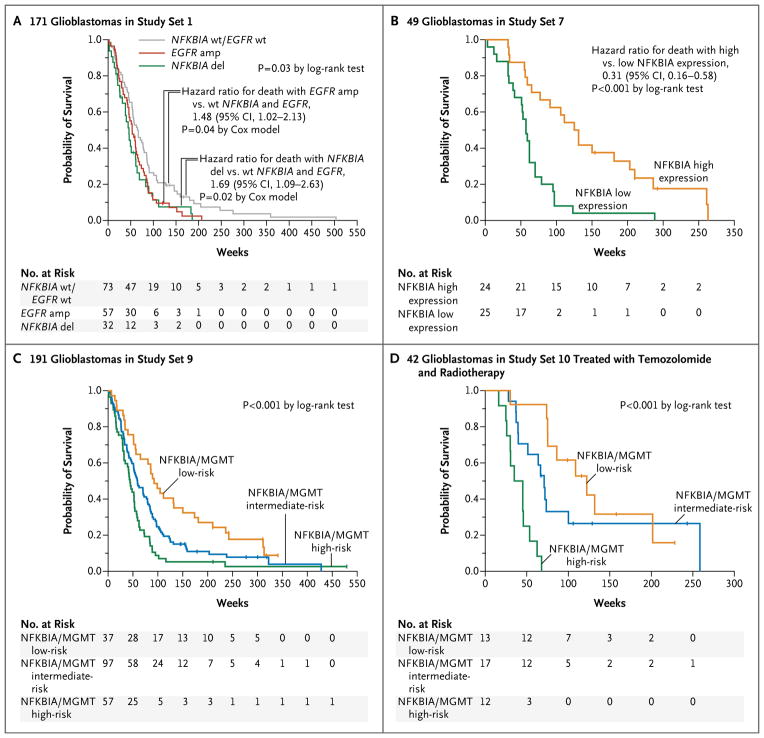
Results: NFKBIA is often deleted but not mutated in glioblastomas; most deletions occur in nonclassical subtypes of the disease. Deletion of NFKBIA and amplification of EGFR show a pattern of mutual exclusivity. Restoration of the expression of NFKBIA attenuated the malignant phenotype and increased the vulnerability to chemotherapy of cells cultured from tumors with NFKBIA deletion; it also reduced the viability of cells with EGFR amplification but not of cells with normal gene dosages of both NFKBIA and EGFR. Deletion and low expression of NFKBIA were associated with unfavorable outcomes. Patients who had tumors with NFKBIA deletion had outcomes that were similar to those in patients with tumors harboring EGFR amplification. These outcomes were poor as compared with the outcomes in patients with tumors that had normal gene dosages of NFKBIA and EGFR. A two-gene model that was based on expression of NFKBIA and O(6)-methylguanine DNA methyltransferase was strongly associated with the clinical course of the disease.

Conclusions: Deletion of NFKBIA has an effect that is similar to the effect of EGFR amplification in the pathogenesis of glioblastoma and is associated with comparatively short survival.


Figures

Figure 1
Figure 1. NFKBIA Deletions in Glioblastomas
The analysis of copy-number variation for chromosome 14 (Panel A) was based on circular binary segmentation in 219 glioblastomas in study set 1. Gene dosages are mapped according to gene order on chromosome 14. NFKBIA is deleted (del) in 24.2% of tumors (yellow line, NFKBIA locus on 14q13). The bar diagram at the bottom of the panel shows the gene-dosage profiles for NFKBIA. Gene-dosage values indicate the log2 ratio of red (R, Cy5) to green (G, Cy3) intensity of the fluorescence dye (or log2R/G), as estimated with the use of the circular binary segmentation algorithm. The deletion of NFKBIA is associated with significant loss of NFKBIA expression in the 175 glioblastomas in study set 1 that had combined gene and transcript data (Panel B). Values for gene dosage and gene expression are presented as log2R/G ratios, as estimated by the circular binary segmentation and robust multigene average preprocessing algorithms, respectively. The box plots show the smallest and largest observations (upper and lower whiskers, respectively), the interquartile range (box), and the median (red line). Data points that are more than 1.5 times the interquartile range lower than the first quartile or 1.5 times the interquartile range higher than the third quartile were considered to be outliers. The P value was calculated with the use of the Wilcoxon rank-sum test. Gene-dosage profiles for NFKBIA and EGFR across 188 glioblastomas in study set 1 are shown (Panel C), along with their relationship to four molecular subtypes of glioblastoma (classical, mesenchymal, neural, and proneural). A corresponding two-way contingency-table analysis reveals a significant association of NFKBIA deletion with the nonclassical subtypes. CI denotes confidence interval.
Figure 2
Figure 2. Pattern of NFKBIA Deletion and EGFR Amplification in Glioblastomas
Panel A shows gene-dosage profiles for NFKBIA and EGFR across 219 glioblastomas in study set 1 and their relationship to each other; the color key indicates the status of both genes in individual tumors. A corresponding two-way contingency table shows that NFKBIA deletion and EGFR amplification occur mutually exclusively in glioblastomas. Panel B shows the relationship between NFKBIA deletion and EGFR amplification in 46 glioblastomas in study set 3 and a corresponding two-way contingency table. Asterisks indicate samples in which there was potential contamination by nontumor tissue.
Figure 3
Figure 3. Effect of NFKBIA Expression in Patient-Derived Glioblastoma Cultures
Primary cultures derived from three patients with glioblastoma are shown, each with a distinct NFKBIA and EGFR status (Patient 1: NFKBIA deleted [del, green font] and EGFR wild type [wt]; Patient 2: NFKBIA wt and EGFR amplified [amp, red font]; Patient 3: NFKBIA wt and EGFR wt). Cultures were infected with a retroviral vector expressing Flag-tagged NFKBIA (NFKBIA+). Protein lysates were subjected to immunoblotting for the detection of Flag-NFKBIA protein expression in relation to α-tubulin loading control. Mean cell viability, measured spectrophotometrically through bio-reduction of 3-(4,5-dimethylthiazol-2-yl)-2,5-diphenyltetrazolium bromide dye by dehydrogenase enzymes of metabolically active cells, reveals a significant reduction in cell viability after expression of NFKBIA in NFKBIA-deleted tumor cells or in EGFR-amplified tumor cells, but no effect in tumor cells with wild-type status for both genes. P values were calculated with the use of an unpaired t-test. T bars indicate standard errors.
Figure 4
Figure 4. NFKBIA and Survivalin Patients with Glioblastomas
Kaplan–Meier estimates of overall survival are shown for 171 patients in study set 1 with newly diagnosed glioblastomas (Panel A), with patients stratified into three subgroups according to the presence of tumors with NFKBIA and EGFR wild-type (wt) status, NFKBIA deletion (del) without EGFR amplification (amp), or EGFR amplification without NFKBIA deletion (9 patients with tumors that had alteration of both NFKBIA and EGFR were omitted owing to the small sample size). Kaplan–Meier estimates of survival are shown for the 49 patients in study set 7 (Panel B), with patients stratified according to median NFKBIA expression. The combined NFKBIA and O-methylguanine DNA methyltransferase (MGMT) risk-group models are shown for 191 patients with glioblastomas in study set 9 (Panel C) and for 42 patients with newly diagnosed glioblastomas in study set 10 who were treated with radiotherapy plus concomitant and adjuvant temozolomide (Panel D). Assignment of patients to low-, intermediate-, or high-risk groups was based on NFKBIA expression (dichotomized at the median) and MGMT status (MGMT expression dichotomized at the 60th percentile or based on MGMT promoter methylation status). In Panel C, NFKBIA expression higher than the median combined with MGMT expression lower than the 40th percentile denotes a low-risk group, and NFKBIA expression lower than the median combined with MGMT expression higher than the 60th percentile denotes a high-risk group. In Panel D, NFKBIA expression higher than the median combined with methylated MGMT promoter status denotes a low-risk group, and NFKBIA expression lower than the median combined with unmethylated MGMT promoter status denotes a high-risk group; all other cases were assigned to an intermediate-risk group. Small vertical lines indicate patients who were alive at the last follow-up assessment. P values were calculated with the use of the log-rank test.

Comment in

References

    1. Wen PY, Kesari S. Malignant gliomas in adults. N Engl J Med. 2008;359:492–507. [Erratum, N Engl J Med 2008;359:877.] - PubMed
    1. Parsons DW, Jones S, Zhang X, et al. An integrated genomic analysis of human glioblastoma multiforme. Science. 2008;321:1807–12. - PMC - PubMed
    1. Yan H, Parsons DW, Jin G, et al. IDH1 and IDH2 mutations in gliomas. N Engl J Med. 2009;360:765–73. - PMC - PubMed
    1. Phillips HS, Kharbanda S, Chen R, et al. Molecular subclasses of high-grade glioma predict prognosis, delineate a pattern of disease progression, and resemble stages in neurogenesis. Cancer Cell. 2006;9:157–73. - PubMed
    1. Bredel M, Scholtens DM, Harsh GR, et al. A network model of a cooperative genetic landscape in brain tumors. JAMA. 2009;302:261–75. - PMC - PubMed

Publication types