. 2010 Dec 21:10:121.
doi: 10.1186/1471-213X-10-121.

A sensitive and bright single-cell resolution live imaging reporter of Wnt/ß-catenin signaling in the mouse

Affiliations

A sensitive and bright single-cell resolution live imaging reporter of Wnt/ß-catenin signaling in the mouse

Anna Ferrer-Vaquer et al. BMC Dev Biol. .

Abstract

Background: Understanding the dynamic cellular behaviors and underlying molecular mechanisms that drive morphogenesis is an ongoing challenge in biology. Live imaging provides the necessary methodology to unravel the synergistic and stereotypical cell and molecular events that shape the embryo. Genetically-encoded reporters represent an essential tool for live imaging. Reporter strains can be engineered by placing cis-regulatory elements of interest to direct the expression of a desired reporter gene. In the case of canonical Wnt signaling, also referred to as Wnt/β-catenin signaling, since the downstream transcriptional response is well understood, reporters can be designed that reflect sites of active Wnt signaling, as opposed to sites of gene transcription, as is the case with many fluorescent reporters. However, even though several transgenic Wnt/β-catenin reporter strains have been generated, to date, none provides the single-cell resolution favored for live imaging studies.

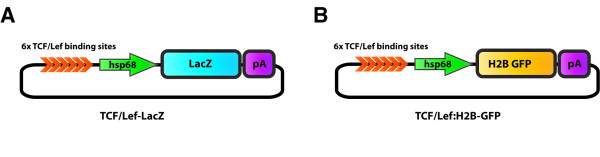
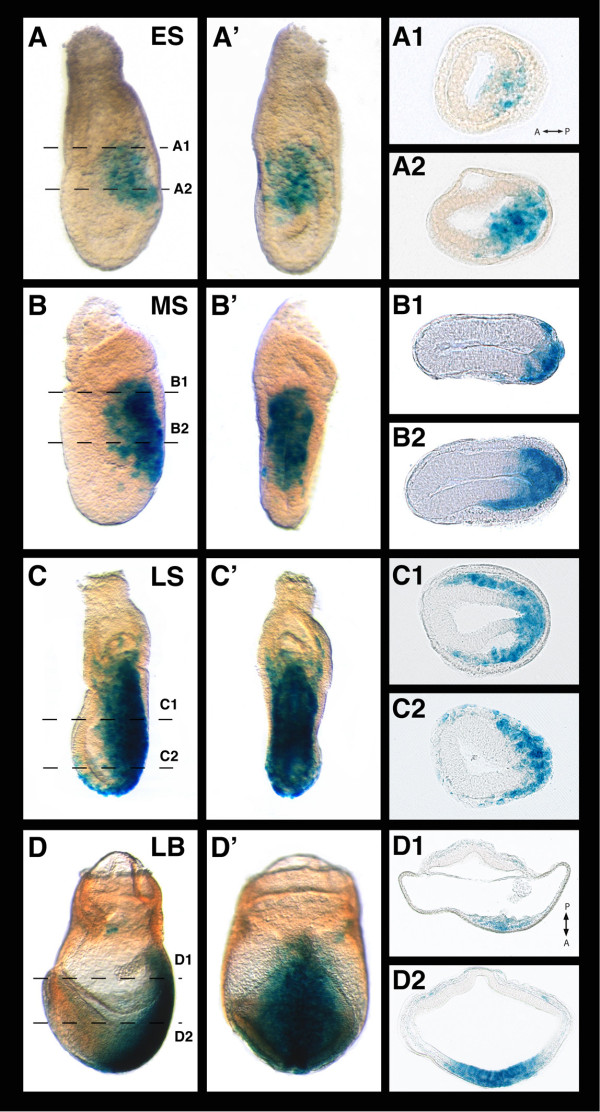
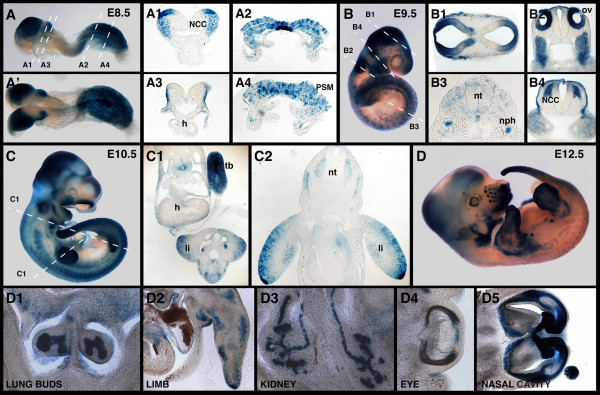
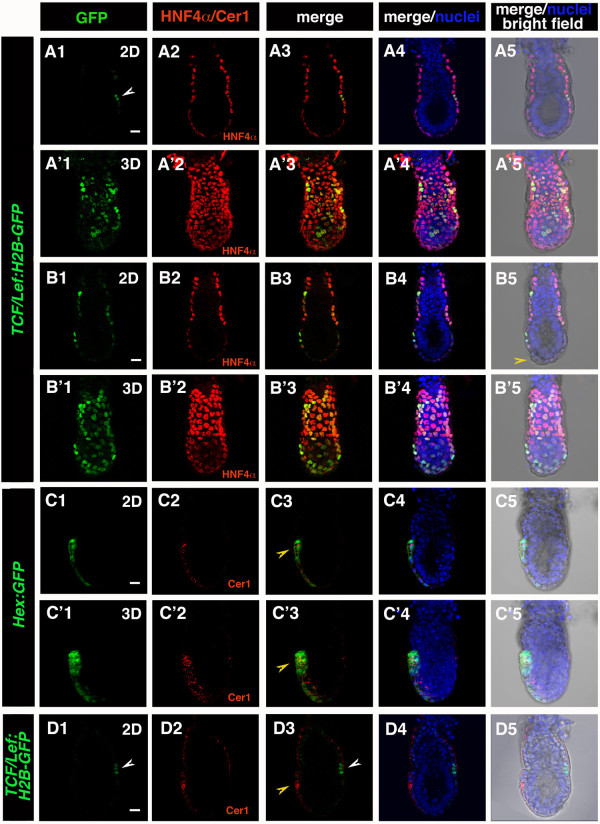
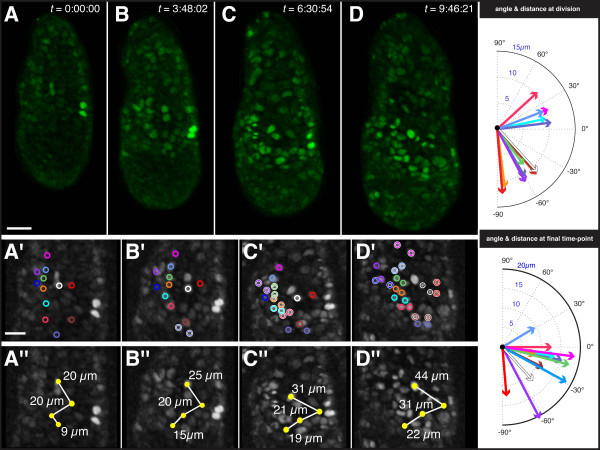
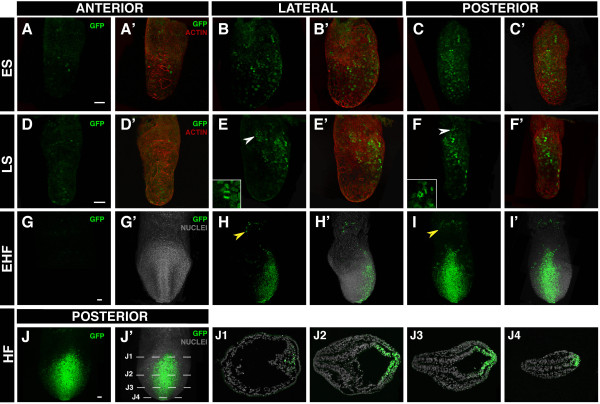
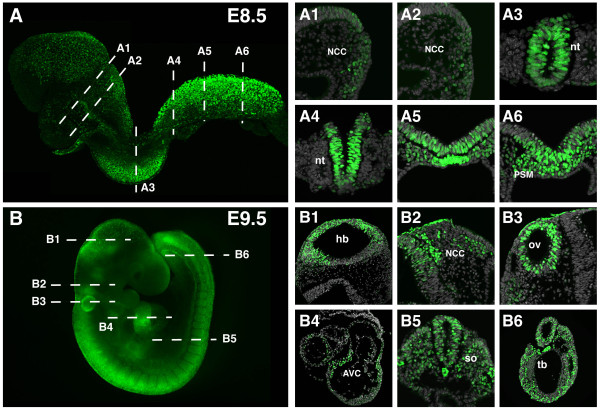
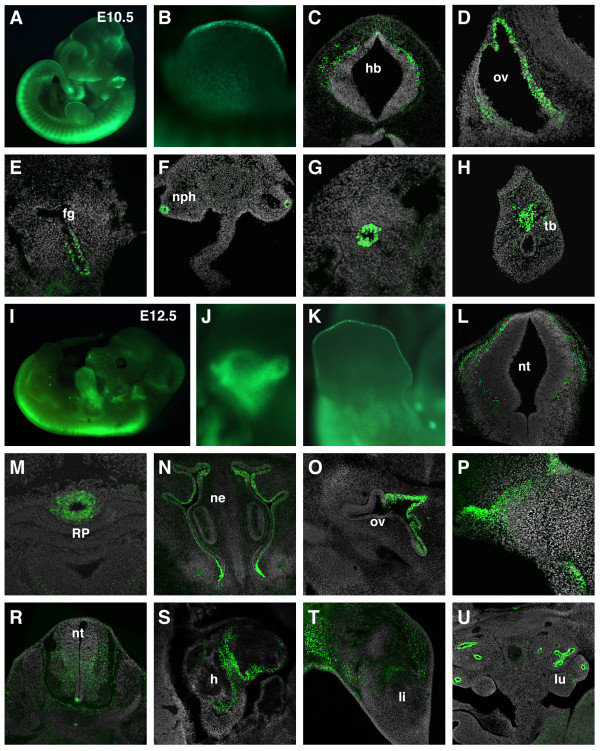
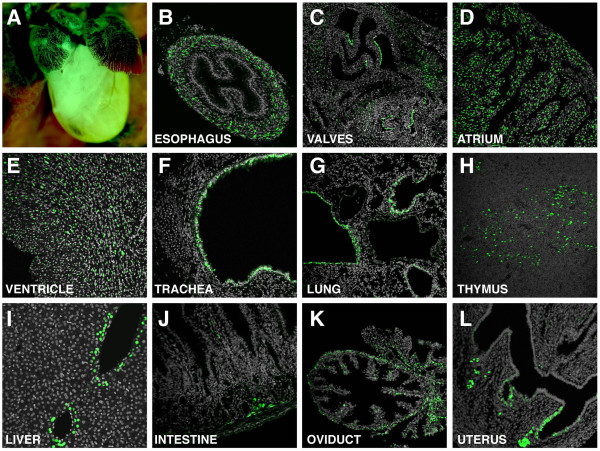
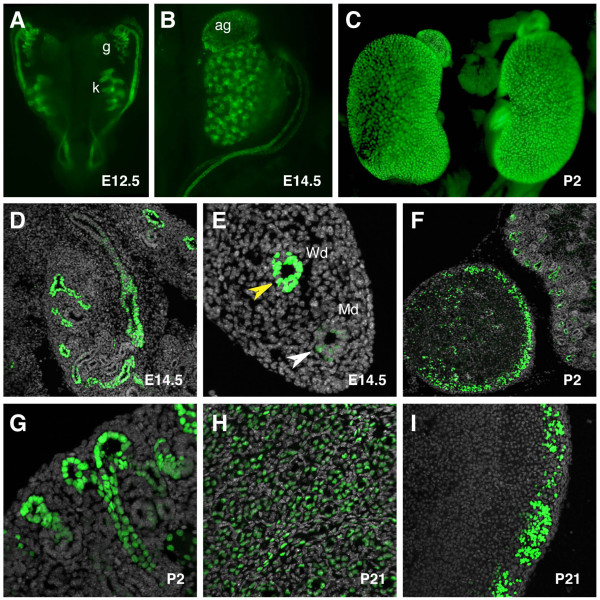
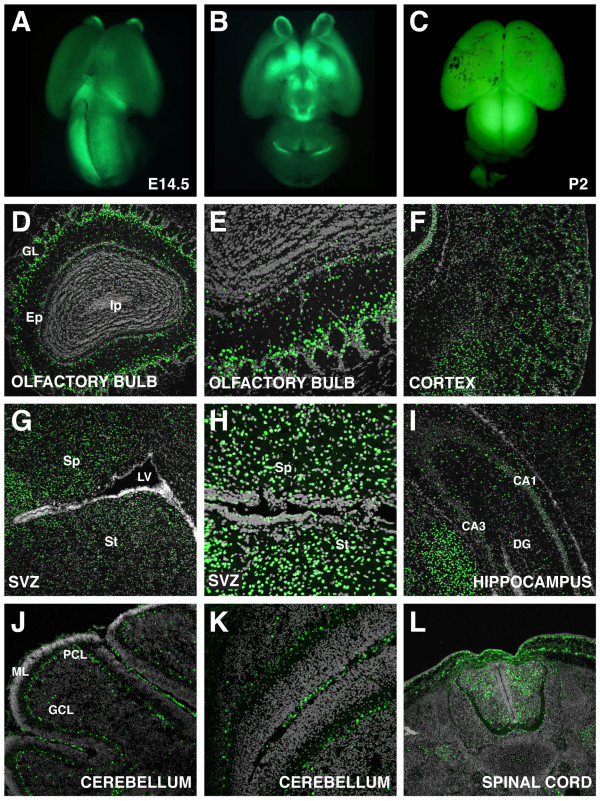
Results: We have placed six copies of a TCF/Lef responsive element and an hsp68 minimal promoter in front of a fluorescent protein fusion comprising human histone H2B to GFP and used it to generate a strain of mice that would report Wnt/β-catenin signaling activity. Characterization of developmental and adult stages of the resulting TCF/Lef:H2B-GFP strain revealed discrete and specific expression of the transgene at previously characterized sites of Wnt/β-catenin signaling. In support of the increased sensitivity of the TCF/Lef:H2B-GFP reporter, additional sites of Wnt/β-catenin signaling not documented with other reporters but identified through genetic and embryological analysis were observed. Furthermore, the sub-cellular localization of the reporter minimized reporter perdurance, and allowed visualization and tracking of individual cells within a cohort, so facilitating the detailed analysis of cell behaviors and signaling activity during morphogenesis.

Conclusion: By combining the Wnt activity read-out efficiency of multimerized TCF/Lef DNA binding sites, together with the high-resolution imaging afforded by subcellularly-localized fluorescent fusion proteins such as H2B-GFP, we have created a mouse transgenic line that faithfully recapitulates Wnt signaling activity at single-cell resolution. The TCF/Lef:H2B-GFP reporter represents a unique tool for live imaging the in vivo processes triggered by Wnt/β-catenin signaling, and thus should help the formulation of a high-resolution understanding of the serial events that define the morphogenetic process regulated by this signaling pathway.


Figures

Figure 1
Figure 1
TCF/Lef:H2B-GFP construct design. TCF/Lef-LacZ (A) and TCF/Lef:H2B-GFP (B) construct design. Each construct consists of six TCF/Lef response elements, which together with the hsp68 minimal promoter, drive the expression of ß-galactosidase in the TCF/Lef-LacZ construct or GFP in the TCF/Lef:H2B-GFP construct.
Figure 2
Figure 2
Charaterization of the TCF/Lef-LacZ transgene expression at gastrulation. Lateral (A) and posterior (A') views of an early streak embryo stained for ß-galactosidase activity. Transverse sections (A1, A2) show LacZ staining at the posterior part of the embryo marking streak initiation. Lateral and posterior views of a mid-streak (B, B') and late streak (C, C') embryos and transverse sections through them (B1, B2, C1, C2 respectively) showing LacZ staining in the primitive streak and wings of mesoderm. Lateral (D) and posterior (D') views of a late bud embryo positive for the transgene and sections through it (D1, D2) along the indicated planes. ES, early streak; LB, late bud; LS, late streak; MS, mid-streak.
Figure 3
Figure 3
Expression of the TCF/Lef-LacZ transgene from E8.5 to E12.5. Lateral (A) and dorsal (A') views of an E8.5 embryo stained for ß-galactosidase activity. Sections through the same embryo show staining in the NCC (A1), the presomitic mesoderm (A2, A4), notochordal plate (A2) and ectoderm (A3). (B) Lateral view of an E9.5 embryo positive for the transgene and sections through it, revealing expression in the brain (B1), NCC (B2, B4), notochord, nephric duct and faintly in the neural tube and somites (B3). (C) Expression of the transgene in an E10.5 embryo and transverse sections (C1, C2) along the indicated planes show staining in the limb, neural tube, gut and tail bud. (D) Whole mount view of an E12.5 embryo stained for ß-galactosidase activity. Sections through the same embryo reveal staining in the lung buds (D1), limb mesenchyme (D2), kidney tubules (D3), eye (D4) and nasal cavity (D5). h, heart; li, limb; NCC, neural crest cells; nph; nephric duct; nt, neural tube; ov, otic vesicle; PSM, presomitic mesoderm; tb, tail bud.
Figure 4
Figure 4
TCF/Lef:H2B-GFP reporter expression in pre-streak stage embryos. Laser scanning confocal images of (A-B, D) E5.5-E5.75 TCF/Lef:H2B-GFP and (C) Hex:GFP embryos. (A, B) H2B-GFP in TCF/Lef:H2B-GFP embryos was localized to the VE in E5.5 embryos, and colocalized with VE marker HNF4α. (A, A') Prior to DVE specification GFP is detected in a subset of VE cells. (B, B') After initiation of DVE migration (B5, yellow arrowhead) GFP is localized in the majority of VE cells, showing varying levels of GFP expression. (C) Cer1 as a marker of AVE- Cer1 localization overlaps with AVE-specific GFP reporter in Hex:GFP embryos (C3, C'3; yellow arrowhead) (D) A group of GFP positive cells (white arrowhead) localized posteriorly (A1, D1), in relation to Cer1 (AVE, yellow arrowhead) localized anteriorly (D3; AVE, yellow arrowhead). Each row represents one embryo. Panels depict single optical sections (A, B, C, D), or 3D reconstructions (A', B', C') of confocal z-stacks. Green, TCF/Lef:H2B-GFP, Hex:GFP; red, Cer1, HNF4α; blue, Hoechst. Scale bar: 20 μm.
Figure 5
Figure 5
Tracking H2B-GFP reporter expressing cells in the visceral endoderm of an E5.5 TCF/Lef:H2B-GFP embryo. Rendered images of 3D time-lapse data of E5.5 TCF/Lef:H2B-GFP embryo acquired on a spinning disc confocal (A-D), with high magnification detail in greyscale shown beneath (A'-D' and A'' = D''). Duration of time-lapse experiment was 9 hours 46 minutes and 21 seconds (t = 9:46:21). Individual cells identified by H2B-GFP nuclear-labeling were color-coded (open circles) and tracked using the spots function in Imaris (Bitplane, Inc.). First panel (A, t = 0) depicts the initial state, with lower panels depicting high magnification views of tracked cells and reference cells. At t = 3:48:02, (B) the first tracked cell division occurs and pushes the bottom-most reference cell to the left. Cell divisions are highlighted with a white outline on the color-coded open circles. In panel C, (t = 6:30:54) nearest-neighbor relationships are preserved subsequent to the near-synchronous division of five cells, despite substantial growth of the embryo. In the final panel, (D, t = 9:46:21) the non-dividing reference cells (yellow closed circles on lower series of panels) have shifted in their relative position and the distance between them has increased; however, the daughter cells produced by previous cell divisions along the left have maintained their nearest-neighbor relationships. The constriction in the range of angle between the cells, as well as the distance between reference cells, suggests that circumferential (lateral) expansion of the embryo is greater than the proximal-distal (longitudinal) growth. Scale bars: 30 μm, upper panel; 20 μm high magnification images, depicted in lower panels.
Figure 6
Figure 6
TCF/Lef:H2B-GFP reporter expression in gastrulating embryos. Laser scanning confocal images of gastrulating embryos from early streak (~E6.5) to early heafold stages (~E7.75). Anterior (A, A'), lateral (B, B') and posterior views (C, C') of an early streak TCF/Lef:H2B-GFP embryo counterstained for actin. Anterior (D, D'), lateral (E, E') and posterior views (F, F') of a late streak embryo counterstained for actin. Anterior (G, G'), lateral (H, H') and posterior views (I, I') of an early headfold embryo counterstained for cell nuclei. Posterior view (J, J') of a headfold embryo and sections (J1-J4) through it along the indicated planes showing GFP expression in the streak and ingressing mesodermal cells. White arrowheads point to mitotic figures. Yellow arrowheads mark blood islands of the yolk sac. Scalebar: 50 μm. ES, early streak; EHF, early headfold; HF, headfold; LS, late streak.
Figure 7
Figure 7
TCF/Lef:H2B-GFP reporter transgene expression in E8.5 and E9.5 embryos. (A) Laser scanning confocal image of an 8-somite embryo and sections through it showing expression in the neural crest cells (A1, A2), the neural tube (A3, A4) and the presomitic and node region (A5, A6). (B) Widefield fluorescent image of a 23-somite stage embryo. Transverse sections reveal transgene expression in the brain (B1), the neural crest cells (B2), otic vesicle (B3), heart (B4), somites, neural tube (B5) and tail bud (B6). Aproximate planes of section are depicted by dashed lines. AVC, atrioventricular canal; hb, hindbrain; NCC, neural crest cells; nt, neural tube; ov, otic vesicle; PSM, presomitic mesoderm; so, somite; tb, tail bud.
Figure 8
Figure 8
Reporter transgene expression during midgestation. (A) Widefield fluorescent image of an E10.5 embryo. (B) Restricted GFP expression in the AER. Bright expression is detected in individual cells in the hindbrain (C), the otic vesicle (D), the foregut endoderm (E), the lining of the mesonephric duct (F, G) and the tailbud. Widefield fluorescent image of an E12.5 embryo (I) and close-ups of the ear (J) and limb (K). Transverse sections at E12.5 reveal transgene expression in the hindbrain (L), the infundibulum (M), the olfactory epithelium (N), the otic vesicle (O), oral ectoderm (P), spinal cord (R), heart (S), limbs (T), lung epithelia (U). fg, foregut; h, heart; hb, hindbrain; li, limb; lu, lung; ne, nasal epithelium; nph, mesonephric duct; nt, neural tube; ov, otic vesicle; RP, Rathke's pouch; tb, tail bud.
Figure 9
Figure 9
TCF/Lef:H2B-GFP expression in postnatal stages. (A) Widefield fluorescent image of a P2 heart. Restricted expression of the transgene is detected in the esophagus (B) and heart valves (C) at P2. At P21, cell-type specific transgene expression is seen in the atrium (D) and ventricle (E) of the heart, tracheal epithelium (F), lung (G), thymus (H), liver (I), intestine (J), oviduct (K) and uterus (L).
Figure 10
Figure 10
TCF/Lef:H2B-GFP reporter gene expression during kidney development. (A) Widefield fluorescent dorsal view of the urogenital tract at E12.5. Widefield fluorescent view of the kidney and suprarenal gland at E14.5 (B) and P2 (C). (D) Expression in the kidney is restricted to the collecting ducts. (E) Mesonephric and paramesonephric ducts positive for the transgene at E14.5. (F) Transverse section through the suprarenal gland showing high levels of the transgene in the cortical region at P2. (G) Detail of the renal cortex at P2 showing a branching event. High magnification images of the kidney (H) and adrenal cortex (I) at P21. Yellow arrowhead marks Wolffian duct, white arrowhead marks Müllerian duct. ag, adrenal gland; g, gonad; k, kidney; Md, Müllerian duct; Wd, Wolffian duct.
Figure 11
Figure 11
Reporter transgene expression in the brain. Widefield fluorescent dorsal (A) and ventral (B) views of an E14.5 mouse brain. (C) Dorsal view of a P2 mouse brain. Section through the whole olfactory bulb (D) and detail (E) showing GFP expression mostly in the periglomerular cells at P21. (F) Widespread transgene expression in the cortex at P9. Sections through a P21 brain showing GFP fluorescence in the septum, striatum (G), ventricle (H) and hippocampus (I). (J) Sagital section through a cerebellar lobe and detail of a fissure showing restricted expression at P9. (L) Transverse section through the spinal cord at E14.5. DG, dentate gyrus; Ep, external plexiform layer; GCL, granule cell layer; GL, glomerular layer; Ip internal plexiform layer; LV, lateral ventricle; ML, molecular layer; PCL, Purkinje cell layer; Sp, septum; St, striatum.

Similar articles

Cited by

References

    1. Gordon MD, Nusse R. Wnt signaling: multiple pathways, multiple receptors, and multiple transcription factors. J Biol Chem. 2006;281:22429–22433. doi: 10.1074/jbc.R600015200. - DOI - PubMed
    1. MacDonald BT, Tamai K, He X. Wnt/beta-catenin signaling: components, mechanisms, and diseases. Dev Cell. 2009;17:9–26. doi: 10.1016/j.devcel.2009.06.016. - DOI - PMC - PubMed
    1. van Amerongen R, Nusse R. Towards an integrated view of Wnt signaling in development. Development. 2009;136:3205–3214. doi: 10.1242/dev.033910. - DOI - PubMed
    1. Barolo S. Transgenic Wnt/TCF pathway reporters: all you need is Lef? Oncogene. 2006;25:7505–7511. doi: 10.1038/sj.onc.1210057. - DOI - PubMed
    1. Korinek V, Barker N, Morin PJ, van Wichen D, de Weger R, Kinzler KW, Vogelstein B, Clevers H. Constitutive transcriptional activation by a beta-catenin-Tcf complex in APC-/- colon carcinoma. Science. 1997;275:1784–1787. doi: 10.1126/science.275.5307.1784. - DOI - PubMed

Publication types